Download
1 / 18
180 likes | 198 Vues
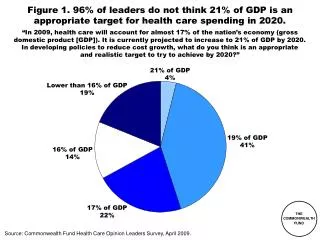
This study analyzes the long-term effectiveness and cost savings projections of health system reform provisions in the House and Senate bills from 2010 to 2019. It evaluates the impact on total health system spending and assesses views from Health Care Opinion Leaders Surveys.

E N D
Starting on the Path to a High Performance Health System:Analysis of Health System Reform Provisions of House of Representatives and Senate Health Reform Bills Commonwealth Fund Staff November 2009
Exhibit ES-1. Projected Savings and Effectiveness of System Reform Provisions in House and Senate Reform Bills 2010–2019 (in billions) Authors’ views of long-term effectiveness in controlling total health system spending: Very effective: +++, Effective: ++, Somewhat effective: +. Health Care Opinion Leaders Surveys: a Dec 2008; b April 2009; c June 2009; d October 2009. Source: Commonwealth Fund estimates; Congressional Budget Office, Letter to the Honorable John D. Dingell, Nov. 6, 2009; Letter to the Honorable Harry Reid, Nov. 18, 2009.
Exhibit 1. National Health Expenditures per Capita, 1980–2007 Data: OECD Health Data 2009 (June 2009).
Exhibit 2. System Improvement Provisions of National Health Reform Proposals, 2009 Note: ACO = accountable care organization; PCP = primary care physician; AHRQ = Agency for Healthcare Research and Quality. HHS = Department of Health and Human Services Source: Commonwealth Fund analysis.
Exhibit 3. System Reform Provisions of House Bill (H.R. 3962) • Health Insurance Exchange, Rules, and Choice of Public and Private Plans • Health insurance exchange administrative savings for individuals and small businesses • Public plan authorized to use new innovative payment methods; secretary of HHS negotiates rates • Minimum Benefit Package; Review premium increases; 85 percent minimum medical loss ratio • Change Provider Payment • Rapid-cycle testing of innovative payment methods • Medical homes • Accountable care organizations • Bundled payments for hospital and post-acute care • Authority to spread in Medicare and incorporate in public plan • Geographic variations: IOM study; Congressional up-or-down vote on recommendations • Productivity improvement; reduction for high hospital readmissions • Strengthen Prevention and Primary Care • Improved coverage of preventive services and elimination of cost-sharing • Enhanced payment for primary care: 5 percent overall, 10 percent in shortage areas • Correct Overpriced Services and Plans • Negotiation of pharmaceutical prices; prescription drug savings • Resetting Medicare Advantage rates to fee-for-service levels with quality bonuses • Center for Comparative Effectiveness and Value-Based Benefit Design • Quality Improvement, Measurement and Public Reporting • Medical Malpractice Demonstrations • Repeal of Insurance Antitrust Exemption
Exhibit 4. System Reform Provisions of Senate Bill • Health Insurance Exchange and Rules • Health insurance exchange administrative savings for individuals and small businesses • Minimum benefit package; Insurers must report minimum medical loss ratio • Choice of private plans, consumer cooperative plans, and a public plan unless state opts out • Strengthen Prevention and Primary Care • Provide PCPs a 10% Medicare payment bonus for 5 years beginning in 2011 • Increase the number of GME training positions • Establish a Workforce Advisory Committee to develop and implement a national workforce strategy • Eliminate cost-sharing for annual wellness visits and evidence-based preventive services • Change Provider Payment • Rapid-cycle testing of innovative payment methods through CMS Innovations Center • Medical homes • Accountable care organizations • Bundled payments for hospital and post-acute care • Authority to spread in Medicare • Productivity improvement; reduction for high hospital readmissions • Restructure payments to Medicare Advantage plans • Center a private, nonprofit Patient-Centered Outcomes Research Institute • Goals and Reporting • Quality improvement, measurement, public reporting • Health goals and priorities for performance improvement Note: PCP = primary care physician.
Exhibit 5. Effect of House and Senate Bills on Insurance Coverage of People Under Age 65, 2019(in millions) Current Law Uninsured 54 m 19% Other 15 m 5% Uninsured 18 m 6% Employer 162 m 59% Uninsured 24 m 9% Medicaid 35 m 12% Other 15 m 5% Other 15 m 5% Medicaid 50 m 18% Nongroup 15 m 5% Medicaid 50 m 18% Employer 159 m 57% Employer 152 m 54% Exchange- Public 6 m 2% Exchange- Public 4 m 1% Exchange- Private 24 m 9% Exchange- Private 26 m 9% Nongroup 9 m 3% Nongroup 10 m 4% Senate H.R. 3962 Source: Congressional Budget Office, Letter to the Honorable John D. Dingell, Nov. 6, 2009; Letter to the Honorable Harry Reid, Nov. 18, 2009.
Exhibit 6. House and Senate Payment and System Reform Savings, 2010–2019 Dollars in billions Source: The Congressional Budget Office Preliminary Analysis of the Patient Protection and Affordable Care Act, Nov. 18, 2009, http://www.cbo.gov/doc.cfm?index=10731. The Congressional Budget Office Analysis of H.R. 3962, The Affordable Health Care for America Act, Incorporating the Manager’s Amendment Offered by Representative Dingell, Nov. 6, 2009, http://www.cbo.gov/doc.cfm?index=10710.
Exhibit 7. Major Sources of Savings and Revenues Compared with Projected Spending, Net Cumulative Effect on Federal Deficit, 2010–2019 Dollars in billions Source: The Congressional Budget Office Preliminary Analysis of the Patient Protection and Affordable Care Act, Nov. 18, 2009, http://www.cbo.gov/doc.cfm?index=10731. The Congressional Budget Office Analysis of H.R. 3962, The Affordable Health Care for America Act, Incorporating the Manager’s Amendment Offered by Representative Dingell, Nov. 6, 2009, http://www.cbo.gov/doc.cfm?index=10710.
6.6% annual growth* Exhibit 8. Medicare Spending with System Savings, 2010–2019:Current Projection and Alternative Scenarios Billions DRAFT—To Be Updated $797 OACT $712 CBO $703 SFC $703 5.4% annual growth* 5.2% annual growth* 5.2% annual growth* $722 * Notes: Compound annual growth rate. Data: Estimates by CMS using Congressional Budget Office (CBO) cost estimates as provided on Oct. 7, 2009 and Nov. 6, 2009 and OACT estimates as provided on Nov. 14, 2009.
Exhibit 9. Bending the Curve: Options that Achieve SavingsCumulative 10-Year Federal Budget Savings Aligning Incentives with Quality and Efficiency • Hospital pay-for-performance –$ 43 billion –$ 3 billion –$ 12 billion • Bundled payment with productivity updates –$123 billion –$201 billion –$110 billion • Strengthening primary care and care coordination –$ 83 billion +$ 6 billion — • Modify the home health update factor — –$ 50 billion –$ 37 billion Correcting Price Signals in the Health Care Market • Reset Medicare Advantage benchmark rates –$135 billion –$158 billion –$175 billion • Reduce prescription drug prices –$ 93 billion –$110 billion –$ 75 billion • Limit payment updates in high-cost areas –$100 billion –$ 51 billion — • Manage physician imaging –$ 23 billion –$ 3 billion — Producing and Using Better Information • Promoting health information technology –$ 70 billion –$ 61 billion –$ 13 billion • Comparative effectiveness –$174 billion +$ 1 billion — Promoting Health and Disease Prevention • Public health: reducing tobacco use –$ 79 billion –$ 95 billion — • Public health: reducing obesity –$121 billion –$ 51 billion — • Public health: alcohol excise tax –$ 47 billion –$ 60 billion — Path Estimate CBO Estimate OMB Estimate Source: R. Nuzum, S. Mika, C. Schoen, and K. Davis, Finding Resources for Health Reform and Bending the Health Care Cost Curve (New York: The Commonwealth Fund, July 2009).
Exhibit 10. Pharmaceutical Spending per Capita: 1995 and 2007Adjusted for Differences in Cost of Living * * 2006 Source: OECD Health Data 2009 (June 2009).
Exhibit 11. CBO Estimates of Major Health Legislation Compared with Actual Impact on Federal Outlays Source: J. Gabel, “Congress’s Health Care Numbers Don’t Add Up,” New York Times, Aug. 25, 2009.
Exhibit 12. Premiums Rising Faster Than Inflation and Wages Cumulative Changes in Components of U.S. National Health Expenditures and Workers’ Earnings, 2000–2009 Projected Average Family Premium as a Percentage of Median Family Income, 2008–2020 Percent Percent 108% 32% 24% Projected * 2008 and 2009 NHE projections. Data: Calculations based on M. Hartman et al., “National Health Spending in 2007,” Health Affairs, Jan./Feb. 2009; and A. Sisko et al., “Health Spending Projections through 2018,” Health Affairs, March/April 2009. Insurance premiums, workers’ earnings, and CPI from Henry J. Kaiser Family Foundation/Health Research and Educational Trust, Employer Health Benefits Annual Surveys, 2000–2009. Source: K. Davis, Why Health Reform Must Counter the Rising Costs of Health Insurance Premiums, (New York: The Commonwealth Fund, Aug. 2009).
Exhibit 13. Total National Health Expenditures (NHE) 2009–2020:Current Projection and Alternative Scenarios NHE in trillions 6.5% annual growth $5.0 $4.7 $4.6 $4.4 5.2% annual growth 5.6% annual growth 5.8% annual growth $2.5 Source: C. Schoen, K. Davis, S. Guterman, and K. Stremikis, Fork In the Road: Alternative Paths to a High Performance U.S. Health System, (New York: The Commonwealth Fund, June 2009).
Exhibit 14. High U.S. Insurance Overhead: Insurance Related Administrative Costs Spending on Health Insurance Administration per Capita, 2007 • Fragmented payers + complexity = high transaction costs and overhead costs • McKinsey estimates adds $90 billion per year* • Insurance and providers • Variation in benefits; lack of coherence in payment • Time and people expense for doctors/hospitals * 2006 Source: 2009 OECD Health Data (June 2009). * McKinsey Global Institute, Accounting for the Costs of U.S. Health Care: A New Look at Why Americans Spend More (New York: McKinsey, Nov. 2008).
Exhibit 15. Illustrative Health Reform Goals and Tracking Performance • Secure and Stable Coverage for All • Percent of population insured • Percent of population with premiums and out-of-pocket expenses within affordability standard • Slowing Growth of Total Health Spending and Federal Health Outlays • Annual growth rate in total health system expenditures • Annual growth rate in Medicare expenditures • Impact on federal budget: new spending, net savings, new revenues • Health Outcomes and Quality • Percent of population receiving key preventive services or screenings • Percent of population with chronic conditions controlled • Percent reduction in gap between benchmark and actual levels of quality and safety • Payment and Delivery System Reform • Percent of population enrolled in medical homes • Percent of physicians practicing in accountable care organizations • Percent of provider revenues based on value
Exhibit 16. Projected Savings and Effectiveness of System Reform Provisions in House and Senate Reform Bills 2010–2019 (in billions) Authors’ views of long-term effectiveness in controlling total health system spending: Very effective: +++, Effective: ++, Somewhat effective: +. Health Care Opinion Leaders Surveys: a Dec 2008; b April 2009; c June 2009; d October 2009. Source: Commonwealth Fund estimates; Congressional Budget Office, Letter to the Honorable John D. Dingell, Nov. 6, 2009; Letter to the Honorable Harry Reid, Nov. 18, 2009.