12 Lead ECG
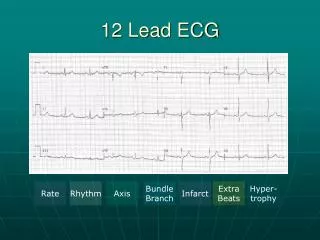
12 Lead ECG. Rate. Rhythm. Axis. Bundle Branch. Infarct. Extra Beats. Hyper- trophy. 300. 150. 100. 75. 60. Back. 58. 50. Rate: Lead II- Counting Large Blocks. 1. 2. 3. 4. 5. 6. Start.

12 Lead ECG
E N D
Presentation Transcript
12 Lead ECG Rate Rhythm Axis Bundle Branch Infarct Extra Beats Hyper- trophy
300 150 100 75 60 Back 58 50 Rate: Lead II-Counting Large Blocks 1 2 3 4 5 6 Start Five small blocks equals one large block – count is from one QRS complex to the next counting: 300, 150, 100, 75, 60, 50. Then decide count between last two numbers
Back Rhythm: Lead II + all Lead II first, then scan from left to right – P wave for every QRS?, PR intervals constant?, R to R intervals constant? T wave QRS P wave R to R interval PR interval
Positive QRS Negative QRS Positive QRS Negative QRS Back Axis Leads I & aVF I aVF Normal Axis: + + Left Axis Deviation: + - Right Axis Deviation: - + Extreme Right Axis Deviation: - -
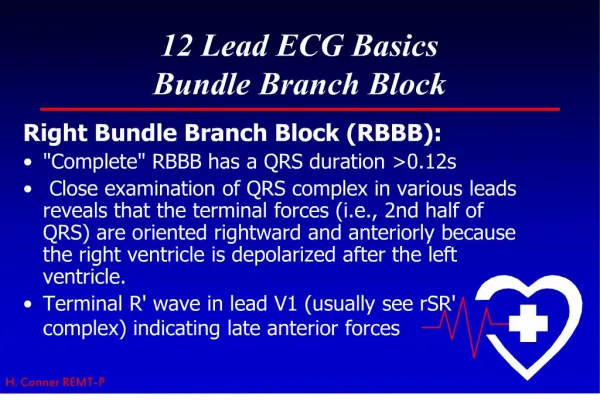
Back Bundle Branch: V1, V5 & V6
Back Infarct: All but aVR Locate Infarct
Impacted area of the heart Back Inferior – Leads II, III & aVF Q waves present ST segment elevation – new depression – old T wave inversion
Back Anterior – Leads V1, V2, V3 & V4 Q waves present ST segment elevation – new depression – old T wave inversion Impacted area of the heart
Back Lateral – Leads I & aVL Q waves present ST segment elevation – new depression – old T wave inversion Impacted area of the heart
Back Posterior – Leads V1 & V2 Large R wave ST segment depression Mirror test Impacted area of the heart (back side)
Back Extra Beats: All Column 4 Column 1 Column 2 Column 3 Check across all leads left to right Check P waves for atrial arrythmias, number and shape Check QRS complex for ventricular arrythmias, wide and bizzare Top to bottom in a column are the same time frame
Back Hypertrophy: V1, V5, V6 R P S Atrial – P wave shape in V1 and is it biphasic? Right Ventricular – R wave greater than S wave in V1 Left Ventricular – Add depth of S wave in V1 to Height of R wave in V5 or V6 which ever is larger 1 small block = 1 mm, 1 large block = 5 mm