Download
1 / 24
240 likes | 262 Vues
Explore simulations and measurements of thermal behavior in electrochemical cells to understand energy production and redistribution dynamics. Comparison and calibration of simulations with experiments for accurate analysis.

E N D
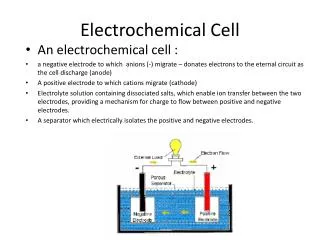
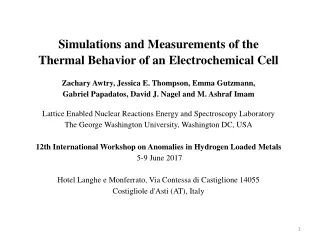
Simulations and Measurements of the Thermal Behavior of an Electrochemical Cell Zachary Awtry, Jessica E. Thompson, Emma Gutzmann, Gabriel Papadatos, David J. Nagel and M. Ashraf Imam Lattice Enabled Nuclear Reactions Energy and Spectroscopy Laboratory The George Washington University, Washington DC, USA 12th International Workshop on Anomalies in Hydrogen Loaded Metals 5-9 June 2017 Hotel Langhe e Monferrato, Via Contessa di Castiglione 14055 Costiglioled'Asti (AT), Italy
Long Range Goal: Reproduce, Control, Understand and Exploit Lattice Enabled Nuclear Reactions Short Range Goal: Reproduce, Control, Understand and Exploit LENR Experiments Methodology: Quantitative assessment of the energetics of experiments by use of both measurements and simulations and comparisons between the two. 1 + 1 = 3
Experiments: Can give reality, but we measure temperatures only in the center of the cell. Simulations: Can be wrong due to many reasons, including inadequate equations, wrong parameters, poor algorithms, inadequate codes, etc. However, simulations give temperatures at all points in space and time. And, simulations give the dynamics of energy production and redistribution. Significant Issue: Calibration and Validation of the Simulations. Calibration by comparison of simulations with measurements , and subsequent adjustment of the simulations, is valuable, but it removes the desirable independence. Validation is done by comparison of other simulation results with other measurements, independent of the calibrations. The above can be very similar to the training of neural networks for Deep Learning analyses of large data sets.
Outline Simulations of LENR Experiments. Experimental Arrangement Experimental Results Simulation Tools Geometrical Design Materials and Properties Mesh Type and Size Electric Fields and Currents Electric Field and Current Density Results Heat Production and Redistribution Temperature Distribution Results Parametric Variations Comparison of Simulations & Measurements Conclusion
Simulations of LENR Experiments Despite the value of simulations of experiments, they are rare in our field. There are various software packages that can be used for multi-physics simulations of LENR experiments. Simulations are challenging due to the complex software and the need for many input parameters. Meshing of the experimental chamber at Tohoku University.
GWU LENR Energy and Spectroscopy Laboratory General View of 20 by 14 foot laboratory Filtered Hood and BioLogic SP-300 System (Blue Box) Faraday Cage for RF and Noise Spectroscopy Light-Tight Box for Optical Emission Experiments
GWU Strategy for Experimental Replication Electrochemical Gas Loading Loading D and Pd H and Ni Original Method: Scientific Research Some Early Work: Continuing Research Early Method: Being Commercialized Some Early Work: Current GWU Program Received relatively little attention after early 1990s. Materials are less expensive than Pd-based experiments. Many diagnostic tools available for electrochemical experiments.
Experiments and Tools in the GWU LENR Laboratory A Few A Few A Few One None Currently, we are using thermometry, and will switch to calorimetry, if our data indicate that we have achieved heat production. While the eventual goal is to understand LENR, the first target is to understand our experiments quantitatively.
Experimental Arrangement Cathode is a 99.5% pure nickel tube 6.5 mm OD with a wall thickness of 0.5 mm bought from Goodfellow in the UK. Anode is a 0.51 mm diameter Pt wire located in all four corners of the cell. Cell is Poly(methyl methacrylate) container 26 mm square and 62 mm high (inside) with 35 ml of electrolyte from TAP Plastics. Electrolytes are all carbonates, as in the 1991-3 papers. Voltages of 1.5, 2.0, 2.5, 3.0, 3.5, and 4.0. V are applied to the cells
Experimental Resistive Heating Results Temperature in Center of Cathode minus the air temperature Only higher voltages give clear temperature differences. Heavier ions give more resistive heating. K2CO3 and Rb2CO3 give similar results. Time constants are on the order of half an hour Maximum temperature rises are 14 oC
COMSOL Simulation Tools: Multi-Physics and Self-Consistent https://www.comsol.com/
Steps in Doing and Using Simulations Flow diagram and outputs of the COMSOL simulation, where circles indicate graphical images and squares indicate plots. Goal is to simulate electrostatic fields, electrical currents, power dissipation and thermal redistribution in Space and Time
Mesh Type, Size and Run Times Even for large meshes, time is needed to achieve iterative self consistency
Voltage Distributions Contour maps of voltage distribution for Na2CO3 with 2.5 V applied The distribution of voltages is non-uniform near the bottom of the cathode The distribution of voltages near the cathode is nicely circular
Electric Field and Current Density Results Top and Side views of the electric field contours for Na2CO3 with 2.5V applied Current density showing the convergence of current onto the central Ni Cathode
Heat Production and Redistribution Heat generated resistively in the electrolyte is distributed by conduction, convection and radiation. It is possible to simulate the temperature at any point in the cell and its surroundings at any time due to the resistive heating. The ultimate distribution of the input electrical energy can be computed. It is possible to simulate the occurrence of LENR on or in the cathode. The addition of LENR power on top of the resistive heating will alter the computed temperature distributions and histories.
Temperature Distribution Results Steady State heat distribution for Na2CO3 with 1.5V applied Temperature difference for a point on the thermocouple compared to a point off the apparatus for different voltages
Thermal Imaging of Cell Exterior Thermal Images of a Cell Taken with a FLIR One Infrared Camera
Cross Sections of the Cell: Variable Time, Electrolyte and Voltage
Experimental Resistive Heating Results Temperature in Center of Cathode minus the air temperature Only higher voltages give clear temperature differences. Heavier ions give more resistive heating. K2CO3 and Rb2CO3 give similar results. Time constants are on the order of half an hour Maximum temperature rises are 14 oC
Computed Parametric Variations Clear temperature differences can be seen for all cases. Heavier ions give more resistive heating. K2CO3 and Rb2CO3 give similar results. Time constants are on the order of half an hour Maximum temperature rises are 38 oC.
Conclusion We learned to use COMSOL and partially modeled our experiments. The temperature variation of conductivity is now being incorporated. Next, we will get and use the Electrochemistry Module. so that we can account for the energy going into electrolysis in full simulations. We are now simulating loading of deuterons into Palladium from the 0.5M LiOD electrolyte in anticipation of experiment with Pd tubes.