Download
1 / 35
350 likes | 503 Vues
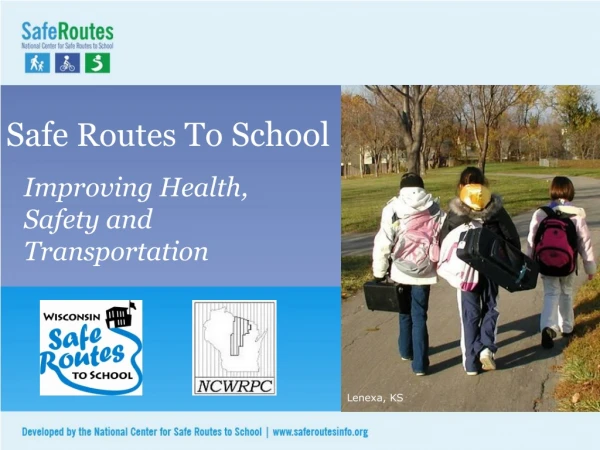
Safe Routes To School. Lenexa, KS. Why Safe Routes To School?. Fewer kids walk and bike to school Health consequences due to inactivity SRTS programs are part of the solution. 1. Fewer kids are biking and walking. More parents are driving. 1969: 42% walked 2001: 16% walked

E N D
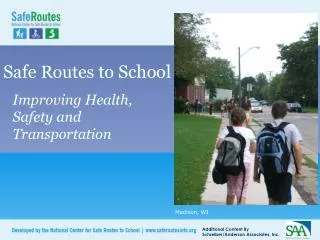
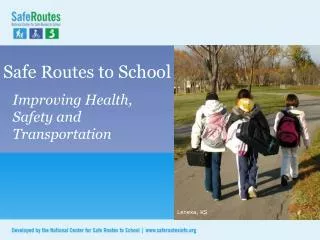
Safe Routes To School Lenexa, KS
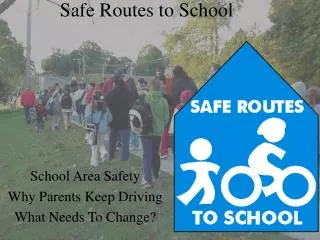
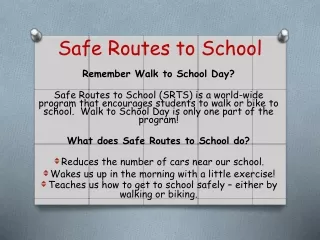
Why Safe Routes To School? • Fewer kids walk and bike to school • Health consequences due to inactivity • SRTS programs are part of the solution
1. Fewer kids are biking and walking. More parents are driving. • 1969: 42% walked • 2001: 16% walked (CDC, 2005)
Parents driving Parents driving children to school: 20%-25% of morning traffic (NHTSA 2003; Dept. of Environment)
It’s not just distance Students who live within 1 mile and walk or bike: 1969: 87% 2001: 63% (CDC, 2005)
2. Unintended consequences of less walking and bicycling? • For the environment • For individual health
Air quality Measurably better around schools with more walkers and bicyclists (EPA, 2003) Chicago, IL
Physical inactivity • Most kids aren’t getting the physical activity they need • Recommended 60 minutes on most, preferably all, days of the week (US Depts. of Health and Human Services and Agriculture, 2005)
U.S. youth overweight rates (National Center for Health Statistics)
Overweight children have an increased risk of… • Type 2 Diabetes • Low self esteem • Decreased physical functioning • Obesity in adulthood • Many other negative emotional & physical effects (Institute of Medicine, 2005)
Good news! Antigo is taking action on behalf of children through Safe Routes to School (SRTS) Winston-Salem, NC Alhambra, CA Phoenix, AZ
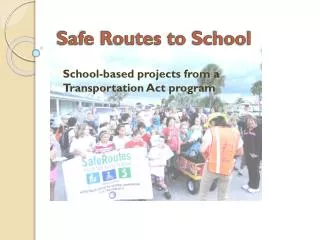
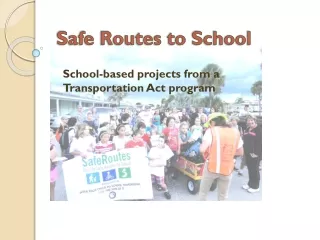
3. Safe Routes to School programs are part of the solution… ...to improve walking and bicycling conditions ...to increase physical activity ...to decrease air pollution Dallas, TX
SRTS Schools in Antigo Middle North East West
SRTS Planning Timeline • August – Planning Grant Awarded • October – Planning Started • November – Walk Audits created 2008: • Aug/Sept – Community Meetings • Fall – Develop alternatives • Fall – Implementation 2009:
Elements of SRTS programs • Education • Encouragement • Enforcement • Engineering • Evaluation Lenexa, KS
Education • Teaches safety skills • Creates safety awareness • Fosters life-long safety habits • Includes parents, neighbors and other drivers Chicago, IL
Encouragement • Increases popularity of walking and bicycling • Is an easy way to start SRTS programs • Emphasizes fun
Enforcement • Increases awareness of pedestrians and bicyclists • Improves driver behavior • Helps children follow traffic rules Richmond, VA Denver, CO
Engineering • Creates safer conditions for walking and bicycling • Can influence the way people behave
Evaluation Is the program making a difference? Survey Parents & Students annually.
Antigo’s SRTS Goals • Where it is safe, get children walking and biking to increase their health. • Improve children’s safety around schools during drop-off and pick-up, so children can walk and bike safely to school.
Antigo Overall…NCWRPC analysis of information • Antigo is generally safe. - Theft and violence still happen. • Major roads and neighborhoods need sidewalks throughout Antigo. - Students are walking on the roads now. • School zone crossings may need upgrades. - Crossing Hwy 45 is necessary for Middle School
Parent Survey (Fall 2008) How did your child get to school? What change is needed before you allow child to walk to school? A survey of parents occurred in Fall of 2008.
Fewer kids are biking and walking. More parents are driving. Fall 2008 Survey Walked , Biked • North: 9% , 4% • East: 22% , 2% • Middle: 8% , 2% • West: 22% , 4%
How do students arrive at East? Students Miles to East Elementary
East students have asked to walk. Students Miles to East Elementary
East parents would allow walking at grade: Students Distance from East Grade
East parents would allow walking/bikingif issue changed: • Top Issues Chg would (unsure)… would not… • …affect decision • Weather/climate 27% (12%) 34% • Safe intersections 29% (5%) 22% • Traffic volume 17% (10%) 29% • Distance 20% (5%) 27%
East parent comments from survey • I would allow child to walk with older student • Need more crossing guards • Sexual predators
Antigo Walking Audit • What is it? • Local assessment of walking conditions within ¼ mile of each school. • Why use audits? • Physically makes people aware of local conditions, and local behaviors.
East East Elem. - Walk Audit Map
East student & parent behaviors fromFall 2008 Walk Audit • Parents parked on both sides of Virginia St and on 7th • Cars parking in No Parking areas by East • House blocks view at Hudson & Field Streets
East Teacher survey resultsFall 2008 • 67% of teachers incorporate bike & ped. safety in class • Parents & students not using crosswalks • Students riding bikes on sidewalks • Speed limits around school seem not enforced
Antigo SRTS What’s next?