Download
1 / 53
530 likes | 534 Vues
This study investigates whether motor vehicle crashes arise from a single or multiple risk processes, examining crash causes and developing a modelling methodology. The research aims to identify the contribution of different processes to the total count of crashes and understand unobserved causes. The study also proposes a Multiple Risk Generating Process (RGP) model for safety performance functions.

E N D
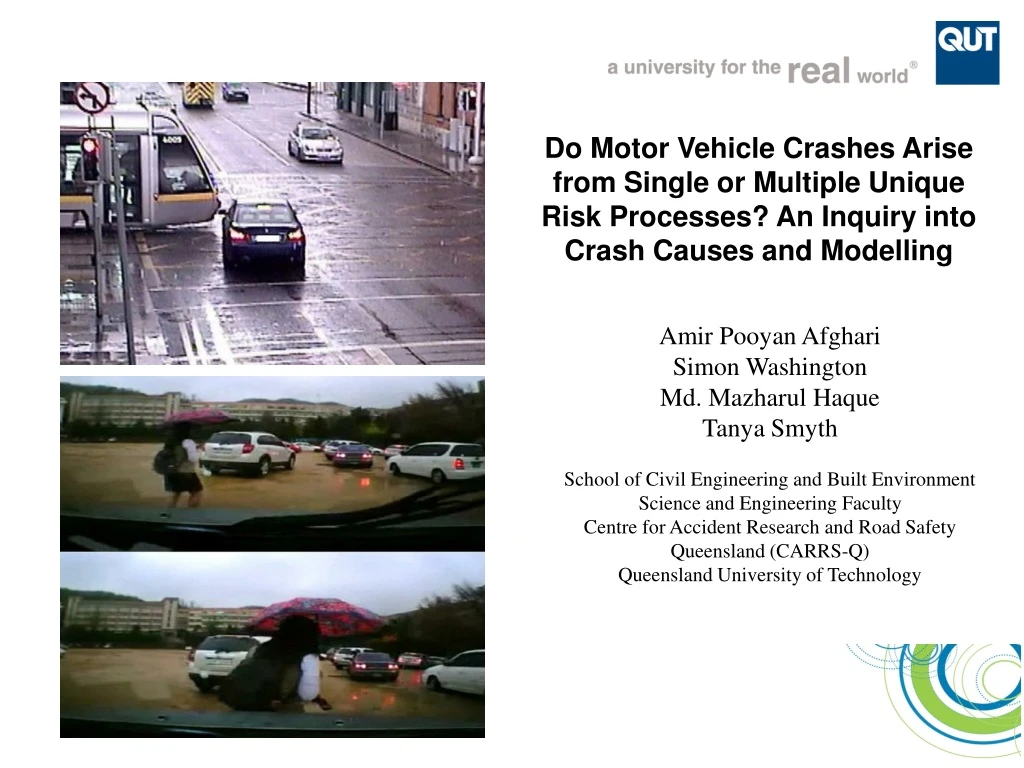
Do Motor Vehicle Crashes Arise from Single or Multiple Unique Risk Processes? An Inquiry into Crash Causes and Modelling Amir PooyanAfghari Simon Washington Md. Mazharul Haque Tanya Smyth School of Civil Engineering and Built Environment Science and Engineering Faculty Centre for Accident Research and Road Safety Queensland (CARRS-Q) Queensland University of Technology
1 Outline • Introduction • Transportation Safety, Crashes, Crash Blackspots • Risk Process Assumption in Crash Causation Mechanisms • Literature Review • Empirical Research Associated with Single Risk Process Assumption • Methodology • Multiple Risk Generating Process Model • Data • Results and Discussion • Conclusions • Limitations
2 Introduction Transportation Safety Crashes Crash Blackspots https://s-media-cache-ak0.pinimg.com/originals
2 Introduction Transportation Safety Crashes Crash Blackspots Crash Causes? Road Signage? Driver Climate https://s-media-cache-ak0.pinimg.com/originals
2 Introduction Transportation Safety Crashes Crash Blackspots Crash Causes? Road Signage? Driver Climate Treat C Treat B Treat A Treat D https://s-media-cache-ak0.pinimg.com/originals
2 Introduction Transportation Safety Crashes Crash Blackspots Crash Causes? Road Signage? Driver Climate Treat C Treat B Treat A Treat D https://s-media-cache-ak0.pinimg.com/originals Budget & Resources
3 Introduction (Predominant) Event 1 at time 1 Event 2 at time 2 Event 3 at time 3 Event 4 at time 4 • Important Theoretical Assumption Underlying Crash Causation Mechanisms Crashes as the results of a single Risk Generating Process (RGP)
4 Introduction • Important Theoretical Assumption Underlying Crash Causation Mechanisms Crashes as the results of a single Risk Generating Process (RGP) http://nettly4.rssing.com http://safety.fhwa.dot.gov/intersection/redlight
3 Introduction (Predominant) Distractionat time 1 • Important Theoretical Assumption Underlying Crash Causation Mechanisms Crashes as the results of a single Risk Generating Process (RGP)
3 Introduction (Predominant) Distractionat time 1 Sharp Curve at time 2 • Important Theoretical Assumption Underlying Crash Causation Mechanisms Crashes as the results of a single Risk Generating Process (RGP)
3 Introduction (Predominant) Distractionat time 1 Sharp Curveat time 2 Kangarooat time 3 • Important Theoretical Assumption Underlying Crash Causation Mechanisms Crashes as the results of a single Risk Generating Process (RGP)
3 Introduction (Predominant) Distractionat time 1 Sharp Curveat time 2 Kangarooat time 3 Rainat time 4 • Important Theoretical Assumption Underlying Crash Causation Mechanisms Crashes as the results of a single Risk Generating Process (RGP)
3 Introduction (Predominant) Distractionat time 1 Sharp Curveat time 2 Kangarooat time 3 Rainat time 4 • Important Theoretical Assumption Underlying Crash Causation Mechanisms Crashes as the results of a single Risk Generating Process (RGP)
5 Empirical Research Associated with Single Risk Process Theoretical Assumption:
6 Fundamental Gaps: • Are crashes the outcomes of a single underlying crash occurrence process?
6 Fundamental Gaps: • Are crashes the outcomes of a single underlying crash occurrence process? 70% Behavioral– 20% Engineering – 10% Spatial Fundamentally Different Sources
6 Fundamental Gaps: • Are crashes the outcomes of a single underlying crash occurrence process? 70% Behavioral– 20% Engineering – 10% Spatial Fundamentally Different Sources - If not, what is the contribution of every process to the total count of crashes?
6 Fundamental Gaps: • Are crashes the outcomes of a single underlying crash occurrence process? 70% Behavioral– 20% Engineering – 10% Spatial Fundamentally Different Sources - If not, what is the contribution of every process to the total count of crashes? - What are the unobserved causes of crashes over the transport network?
7 Introduction • Research Objectives: • Developing a SPF methodology that models the components of crashes as a function of multiple underlying risk generating processes
7 Introduction • Research Objectives: • Developing a SPF methodology that models the components of crashes as a function of multiple underlying risk generating processes • Distinguishing between different proportions of crashes caused by various sources of crash causal factors
7 Introduction • Research Objectives: • Developing a SPF methodology that models the components of crashes as a function of multiple underlying risk generating processes • Distinguishing between different proportions of crashes caused by various sources of crash causal factors • Showing the feasibility: Engineeringand Spatial causes.
8 Methodology (Predominant) Event 1 at time 1 Event 2 at time 2 Event 3 at time 3 New Proposed Mechanism Event 4 at time 4 Traditional Mechanism Postulation of a multiple RGP causation mechanism:
9 Methodology Development of a Multiple RGP Safety Performance Function: Y: total crash counts Y1 = ϴ1 Y ϴ1 + ϴ2 = 100% Y2 = ϴ2 Y
9 Methodology Development of a Multiple RGP Safety Performance Function: Y: total crash counts Y1 = ϴ1 Y ϴ1 + ϴ2 = 100% Y2 = ϴ2 Y Latent Classes
9 Methodology Development of a Multiple RGP Safety Performance Function: Y: total crash counts Y1 = ϴ1 Y µ1 = ω1 µ ϴ1 + ϴ2 = 100% ω1 + ω2 = 100% Y2 = ϴ2 Yµ2= ω2µ Y ~ Poisson (µ)
9 Methodology Development of a Multiple RGP Safety Performance Function: Y: total crash counts Y1 = ϴ1 Y µ1 = ω1 µ ϴ1 + ϴ2 = 100% ω1 + ω2 = 100% Y2 = ϴ2 Yµ2= ω2µ Y ~ Poisson (µ)
9 Methodology Development of a Multiple RGP Safety Performance Function: Y: total crash counts Y1 = ϴ1 Y µ1 = ω1 µ ϴ1 + ϴ2 = 100% ω1 + ω2 = 100% Y2 = ϴ2 Yµ2= ω2µ Y ~ Poisson (µ) Mean Predicted Crash Counts
9 Methodology Development of a Multiple RGP Safety Performance Function: Y: total crash counts Y1 = ϴ1 Y µ1 = ω1 µ ϴ1 + ϴ2 = 100% ω1 + ω2 = 100% Y2 = ϴ2 Yµ2= ω2µ Y ~ Poisson (µ) Exposure Factor
9 Methodology Development of a Multiple RGP Safety Performance Function: Y: total crash counts Y1 = ϴ1 Y µ1 = ω1 µ ϴ1 + ϴ2 = 100% ω1 + ω2 = 100% Y2 = ϴ2 Yµ2= ω2µ Y ~ Poisson (µ) Crash Contributing Factors
9 Methodology Development of a Multiple RGP Safety Performance Function: Y: total crash counts Y1 = ϴ1 Y µ1 = ω1 µ ϴ1 + ϴ2 = 100% ω1 + ω2 = 100% Y2 = ϴ2 Yµ2= ω2µ Y ~ Poisson (µ) Regression Parameters
9 Methodology Development of a Multiple RGP Safety Performance Function: Y: total crash counts Y1 = ϴ1 Y µ1 = ω1 µ ϴ1 + ϴ2 = 100% ω1 + ω2 = 100% Y2 = ϴ2 Yµ2= ω2µ Multivariate Normal Distribution: ∑ = Y ~ Poisson (µ)
9 Methodology Development of a Multiple RGP Safety Performance Function: Y: total crash counts Y1 = ϴ1 Y µ1 = ω1 µ ϴ1 + ϴ2 = 100% ω1 + ω2 = 100% Y2 = ϴ2 Yµ2= ω2µ Multivariate Normal Distribution: ∑ = Bayesian Technique: P[µi| Yi] = Y ~ Poisson (µ)
9 Methodology Development of a Multiple RGP Safety Performance Function: Y: total crash counts Y1 = ϴ1 Y µ1 = ω1 µ ϴ1 + ϴ2 = 100% ω1 + ω2 = 100% Y2 = ϴ2 Yµ2= ω2µ Multivariate Normal Distribution: ∑ = Bayesian Technique: P[µi| Yi] = Y ~ Poisson (µ) Prior Likelihood Posterior
10 Methodology For the Means of Comparison: Traditional Single RGP - Negative Binomial Model: Yi~ Negative Binomial (µi, Φ) GOF Measures (Predictive Performance): Bayesian Information Criterion (BIC) BIC = -2 Log Likelihood + p Log (n)
11 Data State Controlled Roads – Queensland , Australia Extent of the Network: 4913 Road Segments – 33,510 Kilometres
12 3 sets of Data
12 3 sets of Data Crash Data 5 Years (2010 - 2014) Total: 18484 All Severities
12 3 sets of Data Crash Data Engineering Factors Segments Length AADT Percentage of HV Rutting Speed Limit Terrain Surface Seal LOS 5 Years (2010 - 2014) Total: 18484 All Severities
12 3 sets of Data Crash Data Spatial Factors Engineering Factors Rainfall Number of Rainy Days Solar Exposure Sunshine Hours Wind Speed Thunder Days Intensity of Culverts Intensity of Bridges Intensity of Schools Proximity of Schools Segments Length AADT Percentage of HV Rutting Speed Limit Terrain Surface Seal LOS 5 Years (2010 - 2014) Total: 18484 All Severities
Results: 13 Goodness of Fit (GOF): Traditional Single Process Model Multiple Process Model
Traditional Single Process Model Multiple Process Model 14
Traditional Single Process Model Multiple Process Model 14
Traditional Single Process Model Multiple Process Model 14 Wrong Investment
Traditional Single Process Model Multiple Process Model 14
Traditional Single Process Model Multiple Process Model 14
Traditional Single Process Model Multiple Process Model 14
Traditional Single Process Model Multiple Process Model 14
15 Conclusions • To demonstrate the principle of a multiple risk process mechanism for crash causation • The multiple RGP model outperformed the single RGP traditional NB model • Some spatial factors lost their significance • While other spatial factors gained more weight • The multiple RGP methodology illuminates the true significance of crash contributing factors • A proper allocation of resources
16 Limitations and Future Research • Only to show the possibility of using multiple risk processes • Future research should incorporate all 3 risk processes • “Vehicle characteristics” is beyond the scope of road agencies • Use of representative dataset • The need to use more extensive datasets with a wide range of roadway geometric factors • The analysis is still in its initial phases and requires more complex modelling techniques • Future research: Random Parameters modelling, use of complex distributions
Thank You For Your Attention Questions ?