Download
1 / 13
131 likes | 228 Vues
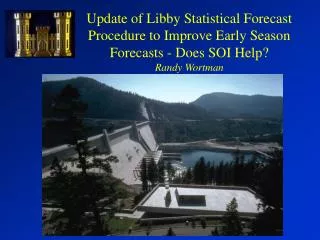
Explore the reasons behind the new Libby Dam Water Supply Forecast (WSF) procedure, its revision in 2010, and the key changes from the previous 2004 procedure. Discover the impact of variables like snowfall, precipitation, and draft targets on operations.

E N D
Libby WSF Procedure • Reasons for new WSF • Last update was in 2004 • A snow course used was lost due to a forest fire • Then lost the replacement snow course • Re-evaluate the variables used in the monthly equations • Lost a precipitation gage in 2009 (Fortine 1N, MT) • 2009 recommendation to review WSF • Reduce month to month forecast variability
Libby WSF Procedure, cont. • Review results in proposed new procedure for implementation in 2010 • Key changes from previous procedure developed in 2004 are: • Snow site are Snotel not snow courses – easier and more efficient access to the data • Fall precipitation variables drop out of the equations in the winter fall forecasts. (Fall precipitation was the the main driver of the 2010 overforecast) • Added Alberta Snotel sites along continental divide that have a high correlation to Libby’s WSF
Libby Dam End of December Variable Draft target • The draft target is a function of the 1 December forecast for the inflow volume from 1 Apr – 31 Aug • If the forecast is >= 5900 KAF target 2411 ft (2.0 MAF of Space) • If the forecast is <= 5500 KAF target 2426.7 ft (relax to 1.4 MAF or 600 KAF) • If the forecast is between 5500 KAF and 5900 KAF relax draft by interpolating between 600 and 0 kaf
Libby Dam SRD • If the forecast is >= 5900 KAF target 2411 ft (2.0 MAF of Space) • If the forecast is <= 5500 KAF target 2426.7 ft (relax to 1.4 MAF or 600 KAF) • If the forecast is between 5500 KAF and 5900 KAF relax draft by interpolating between 600 and 0 kaf
Libby Dam SRD • If the forecast is >= 5900 KAF target 2411 ft (2.0 MAF of Space) • If the forecast is <= 5500 KAF target 2426.7 ft (relax to 1.4 MAF or 600 KAF) • If the forecast is between 5500 KAF and 5900 KAF relax draft by interpolating between 600 and 0 kaf
Libby Dam SRD • If the forecast is >= 5900 KAF target 2411 ft (2.0 MAF of Space) • If the forecast is <= 5500 KAF target 2426.7 ft (relax to 1.4 MAF or 600 KAF) • If the forecast is between 5500 KAF and 5900 KAF relax draft by interpolating between 600 and 0 kaf
Probability of Relaxation 2004 vs 2010 Equation • 2004 Equation • No relaxation = 80% of years • Partial 5900 KAF = ~20% of years • Full 5500 KAF = ~15% of years • 2010 Equation • No relaxation = 47% of years • Partial 5900 KAF = ~53% of years • Full 5500 KAF = ~41% of years