Enhancing Screening Tests with Modern Psychometrics
260 likes | 316 Vues
Learn how modern psychometrics can improve screening tests, including techniques like ROC curves, cognitive testing, health literacy applications. Discover strategies to optimize screening test utility and overcome limitations with IRT. Real-life examples and psychometric methods explained.

Enhancing Screening Tests with Modern Psychometrics
E N D
Presentation Transcript
Improving screening tests with modern psychometrics Paul K. Crane, MD MPH University of Washington General Internal Medicine
Outline • Information revisited • Kirshner and Guyatt framework • Improving screening test techniques • ROC curves • Application to cognitive testing • Application to health literacy • Conclusions
3 Information content 2 1 0 -4 -2 0 2 4 Information revisited • General form: • 2PL model: reduces to D2a2P(θ)[1-P(θ)] • Graph:
Kirshner and Guyatt (1985) • 3 uses of tests • Predictive • Evaluative (follow a condition over time) • Discriminative • Last two uses of tests imply a target information curve
Uses of tests Predictive Evaluative Discriminative Prognostic information for counseling Follow a patient's condition over time Screen asymptomatic patients for disease Schematic
Improving screening test strategies • Two strategies generally used to improve screening test utility • Usually in opposition to each other • Lengthen tests to improve accuracy of screening • Goal is often to decrease costs of working up those who ultimately prove to be screen positive but disease negative • vs. • Shorten tests to decrease respondent burden and decrease the direct costs of screening
Problem with strategies • No unifying framework exists to try to do both things • My plan: combine tools from IRT with tools of screening test development (i.e., ROC curves)
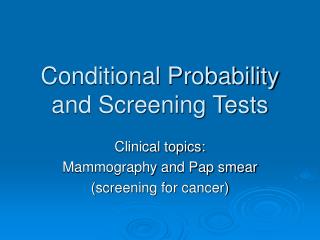
ROC curves • "Signal Dectection Theory" • World War II -- analysis of radar images • Radar operators had to decide whether a blip on the screen represented an enemy target, a friendly ship, or just noise • Signal detection theory measured the ability of radar receiver operators to do this, hence the name Receiver Operating Characteristics • In the 1970's signal detection theory recognized as useful for interpreting medical test results http://gim.unmc.edu/dxtests/roc3.htm
More about ROC curves • ROC curves plot the sensitivity vs. (1-specificity) (the true positive rate vs. the false positive rate) at each possible cutpoint • Useful for visualizing the impact of various potential cutoff points on a continuous measure (continuous binary) • Economic decision on cutpoint; no single right answer
Limitations of ROC curves • Not intended to help with choosing particular items or for improving tests • Doesn’t tell us which parts of the test (items) are helpful in the region of interest • Doesn’t help us in combining the best items from several tests • Can overcome these limitations using IRT
Illustration: cognitive tests • Data are from two epidemiological studies of Alzheimer's disease in population-based samples in Seattle, total n ~5000 (Kame and ACT) • Subjects were given the Cognitive Assessment Screening Instrument (CASI), a 41-item cognitive screening test • Those with lower CASI scores were referred for further evaluation, and consensus diagnoses relating to their dementia status were obtained • Most recent biennial assessment for each individual chosen for this project
Methods • Each individual’s CASI responses were evaluated using PARSCALE v. 3.0 (SSI, 1997) to generate individual cognitive functioning scores • These scores were then combined with DSM-IV diagnosis status using a receiver operator characteristic (ROC) curve • Threshold values identified on the ROC curve • Average information between threshold values calculated for each item
Results: ROC curve 37 and 53 Area under ROC curve = 0.9105 31 30 50 48 32 33 34 1.00 35 36 37 38 39 40 41 42 43 44 45 46 0.75 47 48 49 50 51 0.50 52 53 54 55 56 0.25 57 58 59 60 61 62 0.00 0.00 0.25 0.50 0.75 1.00 1 - Specificity
Comments on study 1 • 9/41 items contribute virtually no information and can be eliminated from the CASI when used as a screening tool for dementia • Remainder of items contribute non-negligibly, but have varying levels of contribution • Choice of which of the other 32 items will depend on content considerations and information • Strengths will come from combining tests
Study 2: health literacy • Goal: self-reported health literacy instrument • 16 item test developed • Six themes identified: • navigating the health care system • completing forms • following medication instructions • interacting with providers • reading appointment slips • using surrogate readers • 5-point Likert scales for how often problems were encountered
Methods • Short Test of Functional Health Literacy in Adults (S-TOFHLA) used in parallel • Inadequate health literacy defined according to S-TOFHLA results (<17) • Data collection at the pre-op clinic at the Seattle VA Medical Center, 2001-2002 • 332 patients eligible and consented (631 scheduled; overall 53% response rate)
Psychometric methods • PARSCALE used to generate scores • ROC curve used to identify regions of interest • Items with minimal information in those regions identified • Impact on area under ROC curve when excluding un-informative items investigated
Removal of items • 8 items identified with least information in these three regions • These items were removed from the test and the scores re-estimated using PARSCALE • New scores used with an ROC curve
Comparison of 16- and 8-item tests • AUC for tests very similar • 0.7534 for 16-item test • 0.7356 for 8 item test • Difference of 0.0178 (0.02) • Steps remaining: try 4 items; validation in a different sample • Problem: measurement error may not be as important as other issues
Conclusions • Several other options in the literature • Neural networks, decision trees, etc. • Logistic regression approaches • This approach combines strengths of ROC curves (plot trade-offs of sensitivity and specificity at each cutpoint) with strengths of IRT (specific management of measurement error) • Comments and questions