Download
1 / 27
270 likes | 276 Vues
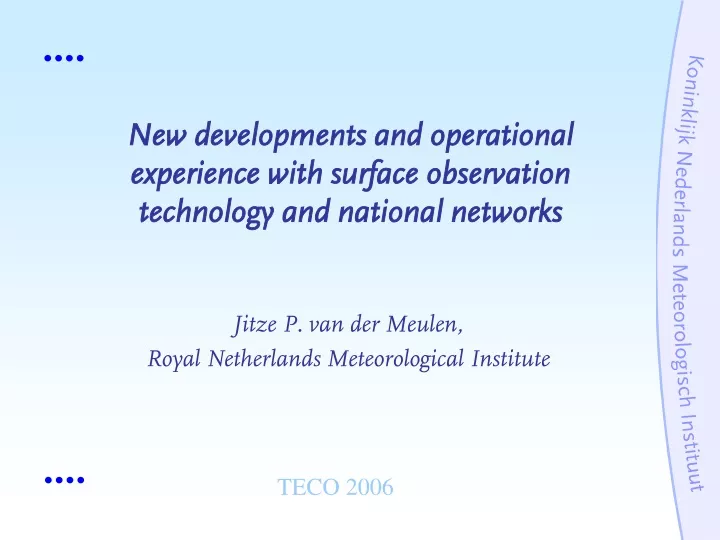
New developments and operational experience with surface observation technology and national networks. Jitze P. van der Meulen, Royal Netherlands Meteorological Institute. TECO 2006. Historic Background.

E N D
New developments and operational experience with surface observation technology and national networks Jitze P. van der Meulen, Royal Netherlands Meteorological Institute TECO 2006
Historic Background • 1643: Evangelista Torricelli discovers vacuum invents mercury barometer and suggested p • 1645:René Descartes suggests p = p(h) • 1650: Blaise Pascal and Robert Boyle, by experiment: p & p = p(h), using a mercury barometer All using calculus: hydrostatics & mathematics TECO-2006
Historic Background • 1802: Alexander von Humboldt, explorer to discover environmental phenomena: t = t(h), later on with Joseph-Louis Gay-Lussac • < 1850: phenomenological studies with a deterministic approach, e.g. networks to measuring the intensity of Earth's magnetic field • > 1850: use of mathematics comes up and experiments produce quantitative data to prove any theory by calculus Discovery of phenomena (qualitative), later on mathematics (quantitative) TECO-2006
Historic Background • > 1835: networks to measure the geological behavior of the earth electromagnetic field in combination with barometers and themometers, to discover any correlation • Measurements of the variable behaviour of atmospheric pressure: a relation with wind (speed and direction) was discovered • Tendency of pressure useful to forecast weather (still popular today at home ) • Geospatial relationship of pressure gradients and the behaviour of wind Discovery of phenomena TECO-2006
Historic Background • > 1845: introduction of Telegraphy, providing in "near real time“ and synoptic surface observations to be plotted in synoptic charts (a ‘nearly instantaneous picture of the state of the atmosphere’) • 1900: postulation that hydrostatic formulas could be used to describe the current state of the atmosphere and for forecasts (‘calculating the weather’) • > 1945 introduction of operational upper air measurements and NWP Use of geophysical data in weather charts, calculus requires “infinite amount” ofarithmetics TECO-2006
Historic Background TECO-2006
Historic Background • Today: Both science and operational services (meteorology, climatology, etc.) are oriented on both • discovery of weather phenomena(the classic deterministic approach), and on • thermodynamics with plenty of mathematics (used in NWP & NCP models). This statement not only holds for in situ measurements but also for remote sensing and especially for observations from satellites (Earth Observation). TECO-2006
Systems development and functional requirements • functional specifications of networks and weather stations have a complex background • A network should provide • present weather information expressed in pre-defined parameters, like type-of-cloud, special phenomena, type-of-precipitation, icing • numerical data, i.e. quantitative physical variables • Complex? Simple compared to the present needs of the multiform disciplines in meteorology and the available technologies of observation, both in situ and remotely sensed TECO-2006
Systems development and functional requirements • Development of observing systems, in particular those systems based on satellite born remote sensing ('discovery' entity, but also producing quantities) • Geospatial differences in network densities • Differences in representativety (area averaged vs. point measurements) • Differences in observation times and frequency in situ satellite TECO-2006
Systems development and functional requirements • Development of observing systems, in particular those systems based on satellite born remote sensing ('discovery' entity, but also producing quantities) • Geospatial differences in network densities • Representativety (area averaged vs. point measurements) wind derived from the ERS-2 scatterometer, south- east of Greenland, 2006-10-15 21:30 UTC TECO-2006
Systems development and functional requirements • The various disciplines in meteorology, climatology, hydrology, etc. expressed an increasing demand on observational data and with discipline specific conditions. • Alternative or new observations, performance, representativety and frequency of observations. • Complete automation (of subjective observations, present weather, phenomena), modern AWS • Strong increasing diversity in both the users' requirements and in observation technology TECO-2006
Systems development and functional requirements USER OBSERVATIONS ¿ SOURCE #1 Sy INFO ¿ Cl INFO SOURCE #2 [Sy] Synoptical Meteorology, [Cl] Climatology, [Hy] Hydrology, [Ag] Agro-meteorology, [Ae] Aeronautical meteorology, [Ma] Marine meteorology, [AS] Sciences of the atmosphere ¿ INFO Hy SOURCE #3 ¿ INFO Ag ¿ Ae INFO ¿ SOURCE #N-1 Ma INFO ¿ INFO AS SOURCE #N TECO-2006 .
Systems development and functional requirements Observations systems database oriented information generators USER ¿ SOURCE #1 Sy INFO ¿ INFO Cl SOURCE #2 ¿ INFO Hy SOURCE #3 ¿ INFO Ag ¿ Ae INFO ¿ SOURCE #N-1 Ma INFO ¿ INFO AS SOURCE #N TECO-2006
Systems development and functional requirements • Defining functional specifications of physical variables to be measured is relatively straightforward: measurement uncertainty can be expressed quantitatively and references are clearly defined. • To specify quality figures for reporting weather events, atmospheric conditions or qualitative descriptions (the assessment of the state and development of the atmosphere, and of significant weather) is complicated and affected by subjectivity:E.g., shall we use performance indicators like • Skill scores • Success rates • False alarms rate, or • A mixture of these? TECO-2006
Systems development and functional requirements • A contingency matrix is most applicable, but how to interpret? detector yes no reality yes ab no cd Event? Probability of Detection: a / (a + b) False Alarm Ratio: c / (a + c) Equitable Skill Score: a / (a + b) – c / (c + d) BIAS = (a + b) / (a + c) [should be 1] TECO-2006
Performance indicators detector yes no reality yes 15%5% no 5%80% POD = 75% FAR = 25% ESS = 69% BIAS = 1 • ‘overall score’ ? • range ?: e.g. ‘icing’ most relevant: ‑2°C < T < +2°C TECO-2006
Systems development and functional requirements • New challenge: observations in combination with a high resolution model: • using the actual NWP grid-point data as background (e.g. 11 km grid) • Using a detailed orographic database (relief map) • Climate data for further fine-tuning + knowledge of atmospheric behavior in land-water transitions • Now-casting technique with ‘downscaling’ capabilities Virtual reality ? 50 km TECO-2006
Systems development and functional requirements Methods of observing Present Weather, also virtual reality? • Determination based on empirical relations • Direct and indirect phenomenological en physical relationships are applied • Climate data as filter tool • Algorithms, tuned for optimal performance TECO-2006
Systems development and functional requirements Methods of observing Present Weather, also virtual reality? Examples: • Undercooled precipitation using wet & dry bulb temperature • Hail detection from doppler weather radars • Precipitation determination based on optical characteristics of the hydrometeors in combination with air temperature TECO-2006
Systems development and functional requirements Methods of observing Present Weather, also virtual reality? • Data from the true world is not available, so validation is a hazardous task • How to calibrate? What is a reliable reference? • Algorithms are not well documented and published • A quality standard for such determination is missing (may be in line with ISO 17025) TECO-2006
Development and new design of instruments • Clustering of sensors/instruments, e.g. on one single statue discarding the mutual impacts TECO-2006
Development and new design of instruments • Clustering of sensors/instruments, e.g. on one single statue discarding the mutual impacts • Micro-sized systems with 'multi-sensors on a single chip' wind sensor TECO-2006
Development and new design of instruments • Clustering of sensors/instruments, e.g. on one single statue discarding the mutual impacts • Micro-sized systems with 'multi-sensors on a single chip' Pressure sensor TECO-2006
Development and new design of instruments • Clustering of sensors/instruments, e.g. on one single statue discarding the mutual impacts • Micro-sized systems with 'multi-sensors on a single chip' • Introduction of ‘alternative’ techniques holograms ‘Hotplate snowgauge’ Acoustic detector monostatic radar: drop size distribution TECO-2006
Trends and criteria for further development, a conclusion • Ongoing development of new methods of observation and measurement devices • Satellite born remote sensing techniques to observe the surface of the whole earth • Ongoing automation of weather stations, automation of observing the weather • All kind of observations to be converted into geo-physical quantities • Determination of weather parameters based on phenomenological assumptions TECO-2006
Trends and criteria for further development, a conclusion • Priority on efficiency and cost reduction • Observation systems and networks will be further optimized; wish to integrate observing systems; surface variables determined from in situ (surface) and remote sensing (satellites) data • Automation of subjective observations to be standardized or at least well documented in open literature; requirements on skill scores • Focus on specific, dangerous weather events, and on methods of observations to improve the performance of NWP TECO-2006
Thank you TECO-2006