Download
1 / 25
250 likes | 398 Vues
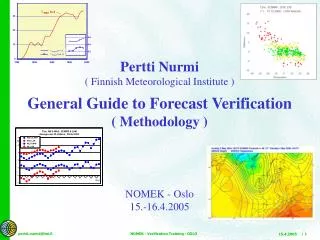
Viel Ødegaard Norwegian Meteorological Institute. Dispersion conditions in complex terrain - a case study of the January 2010 air pollution episode in Norway. Aftenposten. Temperature at different elevations. Near surface temperature gradient observations. 10 m wind, observed.

E N D
Viel Ødegaard Norwegian Meteorological Institute Dispersion conditions in complex terrain - a case study of the January 2010 air pollution episode in Norway Aftenposten
Operational air quality forecasting UK Met Office Unified Model 1 km horizontal resolution 38 vertical levels, lowest level wind 10 m, T and q 20 m Non-hydrostatic 9 surface tiles, urban: rough concrete approach Convection and orographic roughness parameterizations turned off Experimental runs with 0.33 km horizontal resolution dispersion model and emission data base (AirQUIS) Offline hourly data on 10 model levels: u,v,T,q Tsurf, clouds, precipitation, fluxes, BL height daily forecasts for day 2 during winter months
Oslo Bergen Comparing temperature in the free atmosphere with 2m temperature at same elevation
2d trajectories lowest level
2d trajectories lowest level
2d trajectories lowest level
Lowest level wind speed blue: > 2 m/s red: < 2 m/s 1 km resolution 0.33 km resolution
Summary Observing Large scale persistent ridge/high pressure Strong near surface inversion confined to level below 8 (10) m Large temperature increase from low to high elevated stations Low wind speed Significant local variations in wind speed and direction with the same large scale forcing Successfully modeling Inversion evolution Drainage flow Recirculation Local wind variations provided high enough resolution
Thank you for your attention Acknowledgement to Leiv Håvard Slørdal at the Norwegian Institute for Air Research