Download
1 / 1
10 likes | 188 Vues
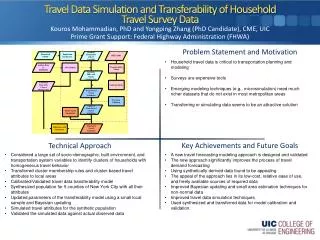
Analysing sources of variability in travel time use using UK National Travel Survey data 2002-2010. Kaveh Jahanshahi, PhD Student, University of Cambridge. Structural Equation Model. Introduction.

E N D
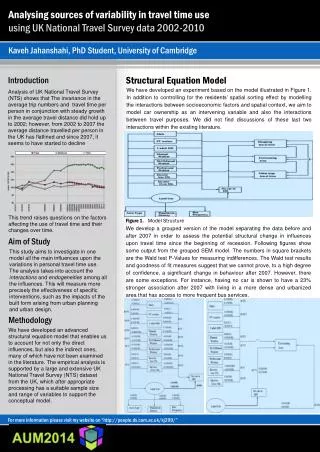
Analysing sources of variability in travel time use using UK National Travel Survey data 2002-2010 Kaveh Jahanshahi, PhD Student, University of Cambridge Structural Equation Model Introduction We have developed an experiment based on the model illustrated in Figure 1. In addition to controlling for the residents’ spatial sorting effect by modelling the interactions between socioeconomic factors and spatial context, we aim to model car ownership as an intervening variable and also the interactions between travel purposes. We did not find discussions of these last two interactions within the existing literature. Analysis of UK National Travel Survey (NTS) shows that The invariance in the average trip numbers and travel time per person in conjunction with steady growth in the average travel distance did hold up to 2002; however, from 2002 to 2007 the average distance travelled per person in the UK has flatlined and since 2007, it seems to have started to decline This trend raises questions on the factors affecting the use of travel time and their changes over time. Figure 1. Model Structure We develop a grouped version of the model separating the data before and after 2007 in order to assess the potential structural change in influences upon travel time since the beginning of recession. Following figures show some output from the grouped SEM model. The numbers in square brackets are the Wald test P-Values for measuring indifferences. The Wald test results and goodness of fit measures suggest that we cannot prove, to a high degree of confidence, a significant change in behaviour after 2007. However, there are some exceptions. For instance, having no car is shown to have a 23% stronger association after 2007 with living in a more dense and urbanized area that has access to more frequent bus services. Aim of Study This study aims to investigate in one model all the main influences upon the variations in personal travel time use. The analysis takes into account the interactions and endogeneities among all the influences. This will measure more precisely the effectiveness of specific interventions, such as the impacts of the built form arising from urban planning and urban design. Methodology We have developed an advanced structural equation model that enables us to account for not only the direct influences, but also the indirect ones, many of which have not been examined in the literature. The empirical analysis is supported by a large and extensive UK National Travel Survey (NTS) dataset from the UK, which after appropriate processing has a suitable sample size and range of variables to support the conceptual model. For more information please visit my website on “http://people.ds.cam.ac.uk/kj299/”