Lines
Lines. Section 1.1. Increments. Important notes:. Slope of a Line. Slope = 0. The slope of horizontal lines?. They have no slope!. The slope of vertical lines?. Parallel and Perpendicular Lines. If lines are parallel and non-vertical, then they have t he same slope.


Lines
E N D
Presentation Transcript
Lines Section 1.1
Increments Important notes:
Slope of a Line Slope = 0 The slope of horizontal lines? They have no slope! The slope of vertical lines?
Parallel and Perpendicular Lines If lines are parallel and non-vertical, then they have the same slope. If lines are perpendicular, then they have opposite reciprocal slopes.
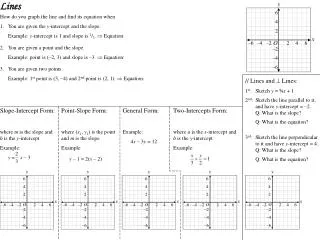
Equations of Lines Point-Slope Form Slope-Intercept Form General (Standard) Form Standing order for this course: Unless otherwise specified, when finding the equation of a line, start with point-slope form, then leave your final answer in slope-intercept form.
Regression Analysis This is the process of finding a curve to fit data. There are four steps: 1. Plot the data (scatter plot). 2. Find the regression equation. For a line, it has the form y = mx + b. 3. Superimpose the graph of the regression equation on the scatter plot to see the fit. 4. Use the regression equation to predict y-values for particular values of x.
Practice Problems Write the equation for (a) the vertical line and (b) the horizontal line through the point P. (b) (a)
Practice Problems Find the (a) slope and (b) y-intercept, and (c) graph the line. Use the intercept (“cover up”) method to graph?... Or, rewrite in slope-intercept form… (2, 0) slope = 3 y-int: – 6 (0, -6)
Practice Problems Write the equation for the line passing through the given point and perpendicular to the given line. First, find the slope of the given line: So the slope of the line we seek:
Practice Problems Write the equation for the line passing through the given point and perpendicular to the given line. Point-slope form: Final answer: What if you had to give the answer in general form?
Practice Problems Find a linear regression model for the given data, then use the model to predict the world population in the year 2010. World Population First, get a scatterplot of these data in the window: Year Population (millions) 1986 4936 1987 5023 1988 5111 1989 5201 1990 5329 1991 5422 The linear regression equation: Both the graph and the r-value (0.998) indicate a good fit to the data According to this model, in 2010, the world population was approximately 7282 million.