Using Technology to Engage Students and Enhance Learning
300 likes | 449 Vues
Using Technology to Engage Students and Enhance Learning . Roxy Peck Cal Poly, San Luis Obispo rpeck@calpoly.edu. Overview. Use of technology in teaching introductory statistics: Technology for Data Analysis Now the norm Use the best available technology

Using Technology to Engage Students and Enhance Learning
E N D
Presentation Transcript
Using Technology to Engage Students and Enhance Learning Roxy Peck Cal Poly, San Luis Obispo rpeck@calpoly.edu
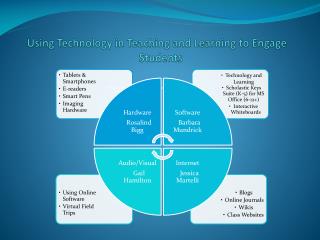
Overview Use of technology in teaching introductory statistics: • Technology for Data Analysis • Now the norm • Use the best available technology • Technology for Developing Conceptual Understanding • Widely used for some things (such as sampling distributions and simulation to estimate probabilities) • Lots of missed opportunities • Other Uses of Technology • Online HW and classroom management systems • Communication (instructor-student, student-student) • Classroom assessment (clickers, poll everywhere)
Technology for Developing Conceptual Understanding Central Concept: Sampling Variability • Acknowledge • Describe • Understand • Take into account when drawing conclusions
The Usual Approach without Technology Wait until week X when you get to the dreaded sampling distributions… Then • Ask students to “imagine…” • Show a static picture of the distribution of • Pray that they understand the relevance and importance (they don’t). • Hope they can get through the rest of the course devoted to inference (some can, but usually by following rote procedures—the logic escapes them, but oh well…)
The Usual Approach with Technology Wait until week X when you get to the dreaded sampling distributions… Then • Show the students an applet (there are lots of good ones out there). Technology replaces the “imagine…” part of the no technology approach. • Pray that they understand the relevance and importance (some do with less left to imagination!). • Hope they can get through the rest of the course devoted to inference (some can, but usually by following rote procedures—the logic escapes them, but oh well…)
I.M.H.O. • Sampling variability and sampling distributions are central to understanding statistics. • These are the most abstract concepts we ask students to grapple with. SO • Why do we keep this hidden until we spring it on students in a one-hour lecture and expect them to get it?!? • Wouldn’t it be better to develop and nurture this idea from the beginning?
There is a BIG Payoff BUT much easier to do if • Plan for it in a thoughtful way. • Have access to technology to facilitate this type of consistent development.
The Missed Opportunities • Week 1: Sampling Methods • Week 3: Graphical Methods • Week 4: Numerical Summary Measures • Week 5: Regression • Week 7: Sampling Distributions • Week 9: Confidence Intervals • Week 10: Hypothesis Testing
Activities Based on Random Sampler • Every student gets a different random sample form the same population. • Students engage with the data and with other students to build understanding.
Random Samplers • Many possibilities • Census@School data base has a random sampler(http://www.amstat.org/censusatschool/) • Random sampling applets(one example: http://www.rossmanchance.com/applets/OneSample.html ) • Textbook resources • Statistical software packages with random sampling capabilities (such as JMP and Minitab)
Activities • Examples that follow are based on sampling from specific populations but can be easily adapted to any population. • The important point is what you ask the students to do and when.
Week 1: Sampling • Sample from a population of adults. Each student gets a different random sample of 20. • Variables: number of text messages sent in a typical day, response to “have you ever sent a text message while driving?”
Week 3 Graphical Methods • Each student gets a different random sample of size 50 from a population of adults • Variables: Gender, age
Big Payoffs • Illustrates • Effect of choice of bins on appearance of histogram. • Even with different bins and different random samples, there are similarities and they still resemble the population distribution in key ways. • Even with different types of graphical displays and different random samples, tend to draw the same conclusions. • All this and we are weeks away from formal treatment of sampling distributions!
Week 5--Regression • Each student gets a different random sample from a population of adults. • Variable: Number of text messages sent, age
Illustrates • Sampling variability in the slope of the regression line • Potential impact of sampling variability on predictions
Week 7—Sampling Distributions • Students are ready for these ideas! • In fact, they have already done what you will now formalize several times and are comfortable with the idea of sampling variability.
And it Continues… • Confidence intervals • Hypothesis tests
Back to Technology Technology is a tool that enables students to engage with the ideas of sampling variability… EARLY AND OFTEN!
Thanks for Attending this Session. Questions? Comments? Contact information: rpeck@calpoly.edu