Download
1 / 13
130 likes | 187 Vues
Development of the NO2 sonde. Wesley Sluis. Ankie Piters. Marc Allaart. Requirements. Range 1-100 ppb Fast (1 second) Lightweight (100 grams) Little power (1 watt) Cheap (disposable) Not dangerous to finder / environment Works at high altitude. Design of the instrument.

E N D
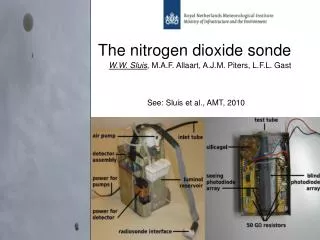
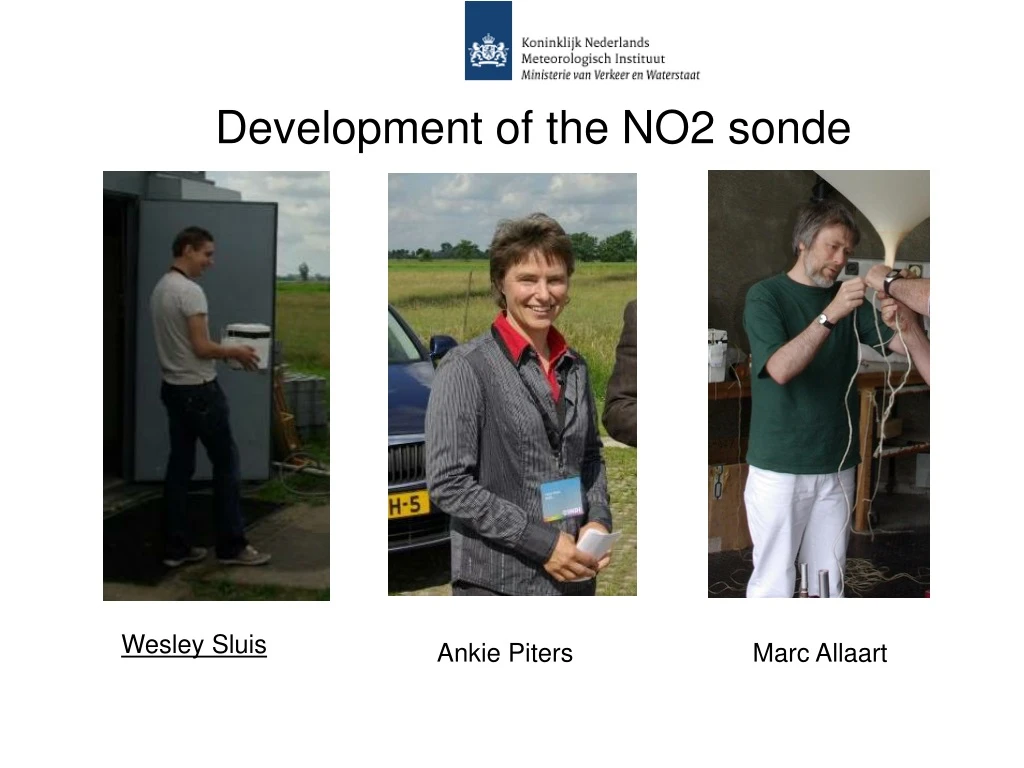
Development of the NO2 sonde Wesley Sluis Ankie Piters Marc Allaart
Requirements • Range 1-100 ppb • Fast (1 second) • Lightweight (100 grams) • Little power (1 watt) • Cheap (disposable) • Not dangerous to finder / environment • Works at high altitude
Temperature dependence (1) • The housing of the sonde is made of Polystyrene (PS), and is a good insulator. • Typical temperature range during a balloon flight (CINDI): 20 – 40 oC. • Temperature rising caused by Teflon air pump. • What is the influence of the temperature on the emitted light signal?
Temperature dependence (2) • Set up: • - Detector in PS box. • - Constant NO2 concentration • introduced to luminol solution. • - CO2 scrubber is used to • prevent acidification. • Temperature is monitored. • Result: • The change in the scaling • factor is within 2.0 % per • degree Celsius for • temperatures starting at • 20 oC to 40 oC.
pH dependence Acidification caused by CO2: CO2 + KOH KHCO3 KHCO3 + KOH K2CO3 + H2O It is also possible to estimate the pH as a function of time, and make a parameterization of the signal as a function of pH. This method makes it possible to correct the instrument’s response for any know initial pH.
Comparison of the NO2 sonde with an in situ monitor • Special thanks to Lou Gast, RIVM
Conclusions • Temperature is characterized, The change in the scaling factor is within 2.0 % per degree Celsius for temperatures starting at 20 oC to 40 oC. • Good comparison with the photolytic analyzer. Measured the same dynamical range of changing NO2 concentrations. • Small variations of 1ppbv NO2 are well captured by the NO2 sonde.
Outlook • Finishing paper about “The development of the nitrogen dioxide sonde”. • Complete the calibration of the NO2 sonde. • Focus on launching some sondes this year. • Promoting NO2 sonde, i.e. EGU 2010
We: • Wesley Sluis • Ankie Piters • Marc Allaart • Thanks: • Ruud Hoogeveen (SRON) • Jan Venema (RIVM) • Yipin.Zhou (EMPA) • Enno Peters (University of Bremen) • Andre van Londen • Richard Rothe • Rob Agterberg • Ed Worrell • Cor van Oort • Werkplaats • Photos: • Piet Stammes • Marc Allaart • This project is partially financed by NIVR : Sciavisi project