Download
1 / 48
480 likes | 496 Vues
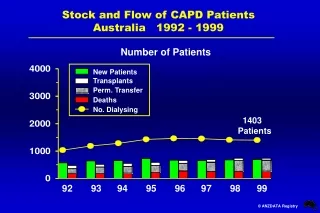
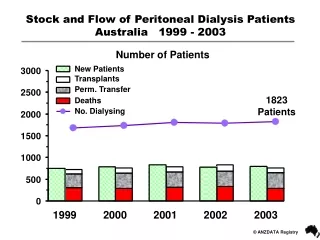
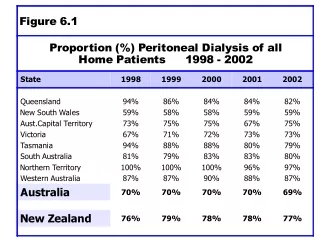
This data illustrates the number of patients, new patients, transplants, transfers, deaths, and dialysis statistics for peritoneal dialysis patients in Australia and New Zealand from 1998 to 2002. It also includes information on the age and BMI of the patients, as well as survival rates and peritonitis-related data.

E N D
Stock and Flow of Peritoneal Dialysis PatientsAustralia 1998 - 2002 Number of Patients New Patients Transplants Perm. Transfer Deaths No. Dialysing 1770 Patients 98 99 00 01 02
Stock and Flow of Peritoneal Dialysis PatientsNew Zealand 1998 - 2002 Number of Patients New Patients Transplants Perm. Transfer Deaths No. Dialysing 767 Patients 98 99 00 01 02
Age of New PD Patients 2002 Australia No. Pats. 18 18 24 79 124 147 229 123 6
Age of Dialysing PD Patients 31-Dec-2002 Australia No. Pats. 24 42 82 182 257 359 523 283 18
PD Patients (%) of all Dialysis Australia31-Dec-2002
Number (Per Million) PD Patients Australia 1998 - 2002
APD Patients (%) of all Dialysis Australia 31-Dec-2002
Number (Per Million) APD Patients Australia 1998 - 2002
PD Patients (%) of all Dialysis New Zealand 31-Dec-2002
Number (Per Million) PD Patients New Zealand 1998 - 2002
APD Patients (%) of all Dialysis New Zealand 31-Dec-2002
Number (Per Million) APD Patients New Zealand 1998 - 2002
Age of New PD Patients 2002 New Zealand No. Pats. 8 5 23 26 60 75 69 21 2
Age of Dialysing PD Patients New Zealand 31-Dec-2002 No. Pats. 11 25 51 74 129 219 178 71 9
Australia 1998 - 2003 200 BMI <20 kg/m2 180 160 140 120 LITRES 100 80 60 40 20 0 Mar-99 Sep-99 Mar-00 Sep-00 Mar-01 Sep-01 Mar-02 Sep-02 Mar-03
Australia 1998 - 2003 BMI 20-24.9 kg/m2 200 180 160 140 120 LITRES 100 80 60 40 20 0 Mar-99 Sep-99 Mar-00 Sep-00 Mar-01 Sep-01 Mar-02 Sep-02 Mar-03
160 140 120 100 80 60 40 20 0 Australia 1998 - 2003 BMI 25-29.9 kg/m2 200 180 LITRES Mar-99 Sep-99 Mar-00 Sep-00 Mar-01 Sep-01 Mar-02 Sep-02 Mar-03
Australia 1998 - 2003 BMI 30 kg/m2 200 180 160 140 120 LITRES 100 80 60 40 20 0 Mar-99 Sep-99 Mar-00 Sep-00 Mar-01 Sep-01 Mar-02 Sep-02 Mar-03
New Zealand 1998 - 2003 200 BMI <20 kg/m2 180 160 140 120 LITRES 100 80 60 40 20 0 Mar-99 Sep-99 Mar-00 Sep-00 Mar-01 Sep-01 Mar-02 Sep-02 Mar-03
New Zealand 1998 - 2003 BMI 20-24.9 kg/m2 200 180 160 140 120 LITRES 100 80 60 40 20 0 Mar-99 Sep-99 Mar-00 Sep-00 Mar-01 Sep-01 Mar-02 Sep-02 Mar-03
New Zealand 1998 - 2003 BMI 25-29.9 kg/m2 200 180 160 140 120 100 LITRES 80 60 40 20 0 Mar-99 Sep-99 Mar-00 Sep-00 Mar-01 Sep-01 Mar-02 Sep-02 Mar-03
New Zealand 1998 - 2003 BMI 30 kg/m2 200 180 160 140 120 LITRES 100 80 60 40 20 0 Mar-99 Sep-99 Mar-00 Sep-00 Mar-01 Sep-01 Mar-02 Sep-02 Mar-03
First PD Treatment to First Peritonitis Related to Age at Entry 1998 - 2002 % Survival Australia Age Group
First PD Treatment to First Peritonitis Related to Age at Entry 1998 - 2002 % Survival New Zealand Age Group
First PD Treatment to First Peritonitis Related to Race Australia 1993-1997 Caucasoid 35-54 yrs 55-64 yrs 35-54 yrs 55-64 yrs Aboriginal/Torres St Maori/Pac Isl
First PD Treatment to First Peritonitis Related to Race Australia 1998-2002 Caucasoid 35-54 yrs 55-64 yrs 35-54 yrs 55-64 yrs Aboriginal/Torres St Maori/Pac Isl
First PD Treatment to First Peritonitis Related to Race New Zealand 1993-1997 Caucasoid 35-54 yrs 55-64 yrs Maori/Pac Isl 35-54 yrs 55-64 yrs
First PD Treatment to First Peritonitis Related to Race New Zealand 1998-2002 Caucasoid 35-54 yrs 55-64 yrs Maori/Pac Isl 35-54 yrs 55-64 yrs
Relationship of Residual GFR to Kt/V Achieved Kt/V March 2003 Litres / week / 1.73m2
Relationship of Residual GFR to Creatinine Clearance Creatinine Clearance (Litres/Week) March 2003 Litres / week / 1.73m2
Relationship of Residual GFR to KT/VMarch 2003 Residual GFR KT/V (Total)95%C.I < 1 ml / min (n=338) 2.07 (1.21 – 2.93) Aust > 1 ml / min (n=939) 2.03 (0.78 – 3.28) < 1 ml / min (n=186) 2.05 (1.17 – 2.93) NZ > 1 ml / min (n=410) 1.77 (0.46 – 3.08)
KT/V Related to Volume of DialysateAustralia March 2003 Prescribed Achieved KT/V (Total) Dialysate Volume 1.8 > 1.8 56 L / week 213 (40%) 317 (60%) 70 L / week 240 (33%) 494 (67%) 453 811
KT/V Related to Volume of DialysateNew Zealand March 2003 Prescribed Achieved KT/V (Total) Dialysate Volume 1.8 > 1.8 56 L / week 148 (63%) 87 (37%) 70 L / week 160 (40%) 235 (60%) 308 322
PET D/P Creatinine at Four HoursNew PD Patients from 1-Apr-99 to 31-Mar-03
Peritoneal Transport Status New PD Patients 1-Apr-1999 to 31-Mar-2003
Delayed Graft Function 1993 - 2002 According to Type of Dialysis CD1 Grafts Australia Chi-square p<0.01
100% 75% 50% Dialysis Type HD (n=2097) 25% PD (n=830) 0% Primary Cadaver Graft Survival 1993 - 2002According to Type of Dialysis 0 2 4 6 8 10 Years