Download
1 / 89
900 likes | 1.09k Vues
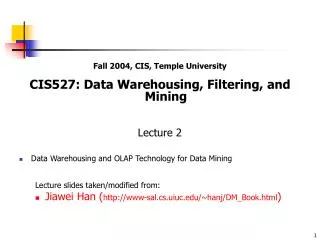
Fall 2004, CIS, Temple University CIS527: Data Warehousing, Filtering, and Mining Lecture 6 Clustering Lecture slides taken/modified from: Jiawei Han ( http://www-sal.cs.uiuc.edu/~hanj/DM_Book.html ) Vipin Kumar ( http://www-users.cs.umn.edu/~kumar/csci5980/index.html ).

E N D
Fall 2004, CIS, Temple University CIS527: Data Warehousing, Filtering, and Mining Lecture 6 • Clustering Lecture slides taken/modified from: • Jiawei Han (http://www-sal.cs.uiuc.edu/~hanj/DM_Book.html) • Vipin Kumar (http://www-users.cs.umn.edu/~kumar/csci5980/index.html)
General Applications of Clustering • Pattern Recognition • Spatial Data Analysis • create thematic maps in GIS by clustering feature spaces • detect spatial clusters and explain them in spatial data mining • Image Processing • Economic Science (especially market research) • WWW • Document classification • Cluster Weblog data to discover groups of similar access patterns
Examples of Clustering Applications • Marketing: Help marketers discover distinct groups in their customer bases, and then use this knowledge to develop targeted marketing programs • Land use: Identification of areas of similar land use in an earth observation database • Insurance: Identifying groups of motor insurance policy holders with a high average claim cost • City-planning: Identifying groups of houses according to their house type, value, and geographical location • Earth-quake studies: Observed earth quake epicenters should be clustered along continent faults
What Is Good Clustering? • A good clustering method will produce high quality clusters with • high intra-class similarity • low inter-class similarity • The quality of a clustering result depends on both the similarity measure used by the method and its implementation. • The quality of a clustering method is also measured by its ability to discover some or all of the hidden patterns.
Requirements of Clustering in Data Mining • Scalability • Ability to deal with different types of attributes • Discovery of clusters with arbitrary shape • Minimal requirements for domain knowledge to determine input parameters • Able to deal with noise and outliers • Insensitive to order of input records • High dimensionality • Incorporation of user-specified constraints • Interpretability and usability
Data Structures in Clustering • Data matrix • (two modes) • Dissimilarity matrix • (one mode)
Measuring Similarity • Dissimilarity/Similarity metric: Similarity is expressed in terms of a distance function, which is typically metric: d(i, j) • There is a separate “quality” function that measures the “goodness” of a cluster. • The definitions of distance functions are usually very different for interval-scaled, boolean, categorical, ordinal and ratio variables. • Weights should be associated with different variables based on applications and data semantics. • It is hard to define “similar enough” or “good enough” • the answer is typically highly subjective.
Interval-valued variables • Standardize data • Calculate the mean squared deviation: where • Calculate the standardized measurement (z-score) • Using mean absolute deviation could be more robust than using standard deviation
Similarity and Dissimilarity Between Objects • Distances are normally used to measure the similarity or dissimilarity between two data objects • Some popular ones include: Minkowski distance: where i = (xi1, xi2, …, xip) and j = (xj1, xj2, …, xjp) are two p-dimensional data objects, and q is a positive integer • If q = 1, d is Manhattan distance
Similarity and Dissimilarity Between Objects • If q = 2, d is Euclidean distance: • Properties • d(i,j) 0 • d(i,i)= 0 • d(i,j)= d(j,i) • d(i,j) d(i,k)+ d(k,j) • Also one can use weighted distance, parametric Pearson product moment correlation, or other disimilarity measures.
Mahalanobis Distance is the covariance matrix of the input data X For red points, the Euclidean distance is 14.7, Mahalanobis distance is 6.
Mahalanobis Distance Covariance Matrix: C A: (0.5, 0.5) B: (0, 1) C: (1.5, 1.5) Mahal(A,B) = 5 Mahal(A,C) = 4 B A
Cosine Similarity • If d1 and d2 are two document vectors, then cos( d1, d2 ) = (d1d2) / ||d1|| ||d2|| , where indicates vector dot product and || d || is the length of vector d. • Example: d1= 3 2 0 5 0 0 0 2 0 0 d2 = 1 0 0 0 0 0 0 1 0 2 d1d2= 3*1 + 2*0 + 0*0 + 5*0 + 0*0 + 0*0 + 0*0 + 2*1 + 0*0 + 0*2 = 5 ||d1|| = (3*3+2*2+0*0+5*5+0*0+0*0+0*0+2*2+0*0+0*0)0.5 = (42) 0.5 = 6.481 ||d2|| = (1*1+0*0+0*0+0*0+0*0+0*0+0*0+1*1+0*0+2*2)0.5= (6) 0.5 = 2.245 cos( d1, d2 ) = .3150
Correlation Measure Scatter plots showing the similarity from –1 to 1.
Binary Variables • A contingency table for binary data • Simple matching coefficient (invariant, if the binary variable is symmetric): • Jaccard coefficient (noninvariant if the binary variable is asymmetric): Object j Object i
Dissimilarity between Binary Variables • Example • gender is a symmetric attribute • the remaining attributes are asymmetric binary • let the values Y and P be set to 1, and the value N be set to 0
Nominal Variables • A generalization of the binary variable in that it can take more than 2 states, e.g., red, yellow, blue, green • Method 1: Simple matching • m: # of matches, p: total # of variables • Method 2: use a large number of binary variables • creating a new binary variable for each of the M nominal states
Ordinal Variables • An ordinal variable can be discrete or continuous • order is important, e.g., rank • Can be treated like interval-scaled • replacing xif by their rank • map the range of each variable onto [0, 1] by replacing i-th object in the f-th variable by • compute the dissimilarity using methods for interval-scaled variables
Ratio-Scaled Variables • Ratio-scaled variable: a positive measurement on a nonlinear scale, approximately at exponential scale, such as AeBt or Ae-Bt • Methods: • treat them like interval-scaled variables — not a good choice! (why?) • apply logarithmic transformation yif = log(xif) • treat them as continuous ordinal data treat their rank as interval-scaled.
Variables of Mixed Types • A database may contain all the six types of variables • symmetric binary, asymmetric binary, nominal, ordinal, interval and ratio. • One may use a weighted formula to combine their effects. • f is binary or nominal: dij(f) = 0 if xif = xjf , or dij(f) = 1 o.w. • f is interval-based: use the normalized distance • f is ordinal or ratio-scaled • compute ranks rif and • and treat zif as interval-scaled
How many clusters? Six Clusters Two Clusters Four Clusters Notion of a Cluster can be Ambiguous
Other Distinctions Between Sets of Clusters • Exclusive versus non-exclusive • In non-exclusive clusterings, points may belong to multiple clusters. • Can represent multiple classes or ‘border’ points • Fuzzy versus non-fuzzy • In fuzzy clustering, a point belongs to every cluster with some weight between 0 and 1 • Weights must sum to 1 • Probabilistic clustering has similar characteristics • Partial versus complete • In some cases, we only want to cluster some of the data • Heterogeneous versus homogeneous • Cluster of widely different sizes, shapes, and densities
Types of Clusters • Well-separated clusters • Center-based clusters • Contiguous clusters • Density-based clusters • Property or Conceptual • Described by an Objective Function
Types of Clusters: Well-Separated • Well-Separated Clusters: • A cluster is a set of points such that any point in a cluster is closer (or more similar) to every other point in the cluster than to any point not in the cluster. 3 well-separated clusters
Types of Clusters: Center-Based • Center-based • A cluster is a set of objects such that an object in a cluster is closer (more similar) to the “center” of a cluster, than to the center of any other cluster • The center of a cluster is often a centroid, the average of all the points in the cluster, or a medoid, the most “representative” point of a cluster 4 center-based clusters
Types of Clusters: Contiguity-Based • Contiguous Cluster (Nearest neighbor or Transitive) • A cluster is a set of points such that a point in a cluster is closer (or more similar) to one or more other points in the cluster than to any point not in the cluster. 8 contiguous clusters
Types of Clusters: Density-Based • Density-based • A cluster is a dense region of points, which is separated by low-density regions, from other regions of high density. • Used when the clusters are irregular or intertwined, and when noise and outliers are present. 6 density-based clusters
Types of Clusters: Conceptual Clusters • Shared Property or Conceptual Clusters • Finds clusters that share some common property or represent a particular concept. . 2 Overlapping Circles
Major Clustering Approaches • Partitioning algorithms: Construct various partitions and then evaluate them by some criterion • Hierarchy algorithms: Create a hierarchical decomposition of the set of data (or objects) using some criterion • Density-based: based on connectivity and density functions • Grid-based: based on a multiple-level granularity structure • Model-based: A model is hypothesized for each of the clusters and the idea is to find the best fit of that model to each other
K-means Clustering • Partitional clustering approach • Each cluster is associated with a centroid (center point) • Each point is assigned to the cluster with the closest centroid • Number of clusters, K, must be specified • The basic algorithm is very simple
K-means Clustering – Details • Initial centroids are often chosen randomly. • Clusters produced vary from one run to another. • The centroid is (typically) the mean of the points in the cluster. • ‘Closeness’ is measured by Euclidean distance, cosine similarity, correlation, etc. • K-means will converge for common similarity measures mentioned above. • Most of the convergence happens in the first few iterations. • Often the stopping condition is changed to ‘Until relatively few points change clusters’ • Complexity is O( n * K * I * d ) • n = number of points, K = number of clusters, I = number of iterations, d = number of attributes
Optimal Clustering Sub-optimal Clustering Two different K-means Clusterings Original Points • Importance of choosing initial centroids
Evaluating K-means Clusters • Most common measure is Sum of Squared Error (SSE) • For each point, the error is the distance to the nearest cluster • To get SSE, we square these errors and sum them. • x is a data point in cluster Ci and mi is the representative point for cluster Ci • can show that micorresponds to the center (mean) of the cluster • Given two clusters, we can choose the one with the smallest error • One easy way to reduce SSE is to increase K, the number of clusters • A good clustering with smaller K can have a lower SSE than a poor clustering with higher K
Solutions to Initial Centroids Problem • Multiple runs • Helps, but probability is not on your side • Sample and use hierarchical clustering to determine initial centroids • Select more than k initial centroids and then select among these initial centroids • Select most widely separated • Postprocessing • Bisecting K-means • Not as susceptible to initialization issues
Handling Empty Clusters • Basic K-means algorithm can yield empty clusters • Several strategies • Choose the point that contributes most to SSE • Choose a point from the cluster with the highest SSE • If there are several empty clusters, the above can be repeated several times.
Pre-processing and Post-processing • Pre-processing • Normalize the data • Eliminate outliers • Post-processing • Eliminate small clusters that may represent outliers • Split ‘loose’ clusters, i.e., clusters with relatively high SSE • Merge clusters that are ‘close’ and that have relatively low SSE • Can use these steps during the clustering process • ISODATA
Bisecting K-means • Bisecting K-means algorithm • Variant of K-means that can produce a partitional or a hierarchical clustering
Limitations of K-means • K-means has problems when clusters are of differing • Sizes • Densities • Non-globular shapes • K-means has problems when the data contains outliers.
Limitations of K-means: Differing Sizes K-means (3 Clusters) Original Points
Limitations of K-means: Differing Density K-means (3 Clusters) Original Points
Limitations of K-means: Non-globular Shapes Original Points K-means (2 Clusters)
Overcoming K-means Limitations Original Points K-means Clusters • One solution is to use many clusters. • Find parts of clusters, but need to put together.
Overcoming K-means Limitations Original Points K-means Clusters
Variations of the K-Means Method • A few variants of the k-means which differ in • Selection of the initial k means • Dissimilarity calculations • Strategies to calculate cluster means • Handling categorical data: k-modes (Huang’98) • Replacing means of clusters with modes • Using new dissimilarity measures to deal with categorical objects • Using a frequency-based method to update modes of clusters • Handling a mixture of categorical and numerical data: k-prototype method
The K-Medoids Clustering Method • Find representative objects, called medoids, in clusters • PAM (Partitioning Around Medoids, 1987) • starts from an initial set of medoids and iteratively replaces one of the medoids by one of the non-medoids if it improves the total distance of the resulting clustering • PAM works effectively for small data sets, but does not scale well for large data sets • CLARA (Kaufmann & Rousseeuw, 1990) • draws multiple samples of the data set, applies PAM on each sample, and gives the best clustering as the output • CLARANS (Ng & Han, 1994): Randomized sampling • Focusing + spatial data structure (Ester et al., 1995)
Hierarchical Clustering • Produces a set of nested clusters organized as a hierarchical tree • Can be visualized as a dendrogram • A tree like diagram that records the sequences of merges or splits
Strengths of Hierarchical Clustering • Do not have to assume any particular number of clusters • Any desired number of clusters can be obtained by ‘cutting’ the dendogram at the proper level • They may correspond to meaningful taxonomies • Example in biological sciences (e.g., animal kingdom, phylogeny reconstruction, …)
Hierarchical Clustering • Two main types of hierarchical clustering • Agglomerative: • Start with the points as individual clusters • At each step, merge the closest pair of clusters until only one cluster (or k clusters) left • Divisive: • Start with one, all-inclusive cluster • At each step, split a cluster until each cluster contains a point (or there are k clusters) • Traditional hierarchical algorithms use a similarity or distance matrix • Merge or split one cluster at a time
Agglomerative Clustering Algorithm • More popular hierarchical clustering technique • Basic algorithm is straightforward • Compute the proximity matrix • Let each data point be a cluster • Repeat • Merge the two closest clusters • Update the proximity matrix • Until only a single cluster remains • Key operation is the computation of the proximity of two clusters • Different approaches to defining the distance between clusters distinguish the different algorithms