Download
1 / 26
260 likes | 377 Vues
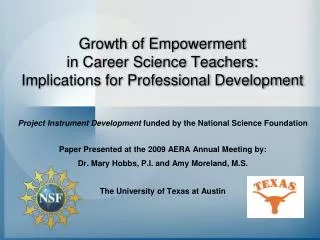
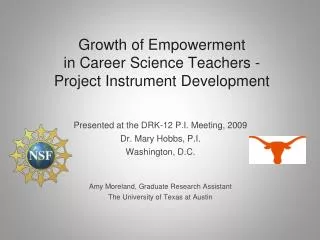
Growth of Empowerment in Career Science Teachers - Project Instrument Development. Presented at the DRK-12 P.I. Meeting, 2009 Dr. Mary Hobbs, P.I. Washington, D.C. Amy Moreland, Graduate Research Assistant The University of Texas at Austin. Problem.

E N D
Growth of Empowerment in Career Science Teachers - Project Instrument Development Presented at the DRK-12 P.I. Meeting, 2009Dr. Mary Hobbs, P.I.Washington, D.C. Amy Moreland, Graduate Research AssistantThe University of Texas at Austin
Problem • Much of the recent education research has focused on new teachers and why large numbers of teachers are leaving the profession (Ingersoll & Smith, 2003). • Few studies have focused on experienced teachers in an attempt to identify factors that may have contributed to their professional growth and retention.
Purpose To develop an instrument to identify those pivotal experiences of career science teachers that have promoted their advancement along the teacher professional continuum and have helped them to persist in their careers
Plan • The researchers in this study used techniques of narrative inquiry, as well as behavior over time (BOT) graphing, to capture the experiences fifty-two teachers identified as having positively or negatively impacted their feelings of empowerment. • The researchers created a multi-domain, online survey instrument to collect statewide and national data: The Online Teacher Empowerment Survey.
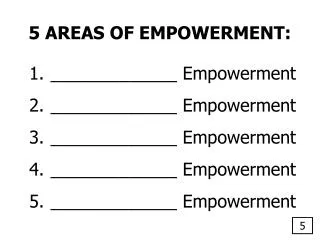
Perspective • What is empowerment and why is it important? • Empowerment is most often viewed as a process through which people become powerful enough to engage in, share control of, and influence events and institutions affecting their lives. • Short (1992) presented six empirically derived dimensions underlying the construct of teacher empowerment – autonomy, self-efficacy, decision-making, status, impact, and professional growth.
Methods • In this study, data collection was accomplished through the use of one-on-one interviews (Clandinin & Connelly, 2000) in conjunction with the Systems Dynamics (Anderson & Johnson, 1997) technique of utilizing behavior-over-time graphing (Year 1). Sample Behavior-Over-Time Empowerment Graph from Nancy, a 17-year science teacher
Methods • The researchers categorized 52 science teacher experiences, identified patterns, and examined the data for congruence with the growth of empowerment model developed by Hobbs (2004) during a previous study (Year 2).
Hobbs’ Empowerment Model • Phase 1: Initiating Empowerment(years 0-3) • Phase 2: Growth of Empowerment(years 4-8) • Phase 3: Sustaining Empowerment • (9+ years) Design adapted from Senge’s The Dance of Change.
Methods • The researchers then developed the survey questions as based on these 52 teacher empowerment interviews, congruence with the empowerment model, and regional focus groups (Year 3).
Data Collection • After many design iterations, as informed by teachers, focus groups, external consulting, and peer feedback, the researchers created a multi-domain, online survey instrument to collect statewide and national data in more efficient ways: The Online Teacher Empowerment Survey (Years 3 - 4). Snowball Data Collection Timeline (to date) of the Online Teacher Empowerment Survey
Online Teacher Empowerment Survey - Example Question 5: Professional Development
With the definition of professional growth in mind, which of the following best describes your current sense of Professional Growth? (Choose one) [N=252] 48%: “Teaching is a profession and professions require continuing education.” 46%: “I’ve always had a big commitment to professional development - I think that’s just been a big consistent for me .”
Data Analyses Methods • Upon receiving the first 250 initial respondents (requirement of this grant), the project’s statistician ran a Rasch rating scale program to access the psychometric properties of the survey. It is important to create linear continuous variables from ordinal responses when using surveys. Too often, researchers use ordinal data with parametric procedures to analysis data (analysis of variance; t-test, etc.). Parametric analyses were intended for use with means and standard deviations that meet statistical analysis assumptions. • In this study, a linear continuous variable was created (Empowerment) that met homogeneity of variance, skewness, kurtosis, missing data, and outlier assumptions. • The descriptive statistics indicated the desired range of 0 to 100 for the Empowerment scaled score. The mean and standard deviation indicate that Empowerment scores at the 95% confidence level (mean +/- 1.96 * standard deviation) would fall between 10 and 82.
Empowerment Score Interpretation • The Empowerment scores were comprised of 7 items which had an internal consistency of .99. This implies a very good construct scale. The person reliability coefficient was .41 indicating that teachers did not respond consistently on the scale, which is expected when a construct scale indicates different levels of the construct. • The Empowerment score did not differ significantly by most of the demographics for this sample (i.e. gender & ethnicity). However, this does not invalidate the Empowerment scale. The Empowerment scores do have sufficient range to indicate more or less of the construct Empowerment. • The Empowerment scale can be used as a diagnostic measure to indicate whether a teacher has low, average, or high self empowerment.
Preliminary Results – Trends • Although the mean Empowerment score indicated an increasing trend from 38.19 to 48.87 across the teaching groups, the F = 2.138, p = .096 indicated there was no statistically significant mean difference between the years of teaching groups at the .05 level of significance.
Preliminary Results – Trends • A visual inspection suggests that PK to Elementary Teachers had higher Empowerment scores, so basically the trend is that Empowerment decreases as grade level increases. However, this trend was not statistically significant (One way ANOVA of Empowerment Score: F = 2.047, p = .131).
Preliminary Results – Trends • The Empowerment scores for the Rural school districts were on average 5.5 points lower than the Urban and Suburban school districts. However, the mean differences were not statistically significant (One way ANOVA of Empowerment ScoreF = 2.29, p = .10) at the .05 level of significance.
Preliminary Results – Trends • A visual inspection suggests that traditionally certified teachers on average had higher empowerment scores (46.98 versus 44.38), however, this was not statistically significant (t value = 1.07, p = 0.285).
Preliminary Results – Significant Trends • Teachers who have participated in a community of learners program where they received 60+ hours of professional development had a statistically significant higher average Empowerment score than Teachers who did not (t = 2.138, p = .033) and scored on average 5 points higher. In this analysis, the number of professional development hours did matter.
Summary • Empowerment scores on average were statistically different for Teachers who received 60+ hours of professional development training versus those who did not. • The Empowerment score differences for the other demographic variables are in the direction one would expect, although for this sample of teachers the differences were not of sufficient magnitude to indicate statistical significance at the .05 level of significance. • Another sample of teachers might well indicate differences in average Empowerment scores for the other demographic variables used in this analysis.
Further Research • Years of teaching experience and number of PD hours if left as continuous variables could better indicate a “positive” relationship with Empowerment scores. Basically, a statistically significant correlation coefficient would indicate that as number of PD hours and years of teaching increases, the Empowerment score increases; similar interpretation for number of hours of professional development. • The Empowerment scores can be used as a diagnostic measure to indicate which teachers have lower than average levels of self empowerment. The distribution of Empowerment scores can be considered normally distributed. As indicated by the quartile distribution, scores in the range 0 to 34 have low self empowerment; scores in the range 35 to 60 have average self empowerment; and finally scores in the range 61 to 100 have high self empowerment.
Researchers Contact Information Mary E. Hobbs, Ph.D.(Co-P.I.)Coordinator for Science InitiativesTexas Regional CollaborativesThe University of Texas at Austinmaryhobbs@mail.utexas.edu James P. Barufaldi, Ph.D.(Co-P.I.) Principal Investigator Texas Regional Collaboratives The University of Texas at Austin jamesb@mail.utexas.edu Amy L. Moreland, M.S. Graduate Research Assistant The University of Texas at Austin amy_moreland@mail.utexas.edu