Equilibrium in Acid-Base Systems
120 likes | 160 Vues
Learn how to interpret pH curves in titrations with keywords such as equivalence point, buffering, titration curve, acid-base indicators, polyprotic entities, and more. Practice questions provided.

Equilibrium in Acid-Base Systems
E N D
Presentation Transcript
Equilibrium in Acid-Base Systems 16.4a: Interpreting pH curves
Titrations • equivalence point- when the exact theoretical amount of titrant has been added (reaction is at completion) • end point- an experimental amount that causes an observable change (colour, pH conductivity…) • ideally the equivalence point and endpoint should be the same • indicator- chemical substance that changes colour near equivalence point • equivalence point is usually marked by the color change (end point) of an indicator
Buffering and the pH curve • the ability of some solutions of counteracting any significant change in pH when an acid or base is added • there are two buffering regions in a monoprotic pH curve • at the start and end of the reaction • in the middle is a sudden change in pH • the equivalence & end points should be found on this vertical portion
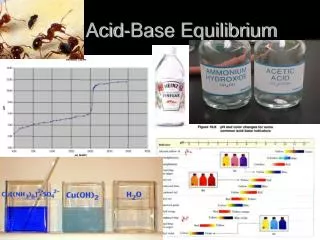
pH curve also called a titration curve plotting of pH of the sample as a function of the amount of titrant added
Strong Acid and Strong Base very gradual changes in pH until close to the equivalence pt.
Acid-Base Indicators is a conjugate weak acid-weak base pair formed when an indicator dissolves in H2O used to mark end of titration (equivalence point) only works if you choose one whose end point is the same as equivalence point colour change occurs when H+ is removed phenolphthalein • HIn + H2O H3O+ + In- • WA WB CWA CWB • yellowblue
Polyprotic Entities acids/bases that can donate/accept more than one H+ always dissociates one H+ at a time Example: carbonic acid H2CO3 H+ + HCO3- Ka1= 4.3x10⁻⁷ HCO3- H+ + CO32- Ka2 = 5.6x10⁻¹¹ Ka1 > Ka2 > Ka3 for typical weak polyprotic acid
Polyprotic pH curves - acid v. carbonate Sodium carbonate reacts with hydrochloric acid in two steps... Step 1 Na2CO3 + HCl ——> NaHCO3 + NaCl Step 2 NaHCO3 + HCl ——> NaCl + H2O + CO2 Overall Na2CO3 + 2HCl ——> 2NaCl + H2O + CO2 There are two sharp pH changes Volume of HCl added is the same in both steps since mole ratio is the same in both.
Polyprotic pH curves - acid v. carbonate Sodium carbonate reacts with hydrochloric acid in two steps... Step 1 Na2CO3 + HCl ——> NaHCO3 + NaCl Step 2 NaHCO3 + HCl ——> NaCl + H2O + CO2 Overall Na2CO3 + 2HCl ——> 2NaCl + H2O + CO2 There are two sharp pH changes First rapid pH change around pH = 8.5 due to the formation of NaHCO3 . Can be detected using phenolphthalein Second rapid pH change around pH = 4 due to the formation of acidic CO2 . Can be detected using methyl orange.
Homework • Textbook p754 #1,2 • Textbook p759 #5-9 • LSM 16.4 A&F