Download
1 / 14
150 likes | 309 Vues
PEDIGREE CHARTS. A family history of a genetic condition. Quick Review. Genotype = what genes someone has Genes are usually represented by a letter, a capital letter for the dominant trait, a small case for the recessive.

E N D
PEDIGREE CHARTS A family history of a genetic condition
Quick Review • Genotype = what genes someone has • Genes are usually represented by a letter, a capital letter for the dominant trait, a small case for the recessive. • Example: Tongue Rolling is dominant, so we use R to represent the tongue rolling • Inablility to roll your tongue is recessive so we use r to represent the non-rolling gene • For every trait, you get a gene from each parent
Mom and Dad are Rr-that is their genotype, they can also be described as heterozygous-they have 1 of each gene What is their PHENOTYPE? (Roller or non-roller?) The youngest son has a genotype of rr-he is Homozygous recessive-2 copies of the recessive gene His phenotype? Genotypes and Phenotypes Rr Rr rr Rr Rr Rr
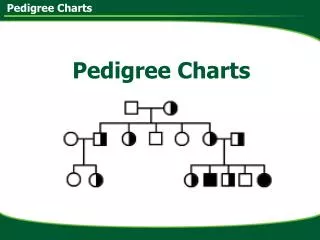
What is a pedigree chart? • Pedigree charts show a record of the family of an individual • They can be used to study the transmission of a hereditary condition • They are particularly useful when there are large families and a good family record over several generations.
Studying human genetics • Pedigree charts offer an ethical way of studying human genetics (Because you cannot make certain individuals breed in order to study genetics.) • Today genetic engineering has new tools to offer to doctors studying genetic diseases • A genetic counsellor will still use pedigree charts to help determine the distribution of a disease in an affected family
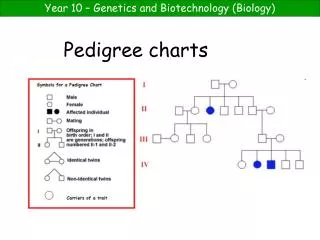
A marriage with five children, two daughters and three sons. The next to eldest son is affected by the condition. Eldest child Youngest child Symbols used in pedigree charts • Normal male • Affected male • Normal female • Affected female • Marriage
Shaded individuals have the trait you’re studying Boys = squares Girls = circles Symbols
Married-connected at side Siblings-connected at TOP not at the side (hopefully not siblings AND married) Oldest child-to the left Question-if shaded individuals in this pedigree have blue eyes, what is the GENOTYPE of the parents?
Divorced, separated Deceased Identical twins Fraternal twins Other Symbols
Organising the pedigree chart • A pedigree chart of a family showing 20 individuals
I II III IV Organising the pedigree chart • Generations are identified by Roman numerals
I II III IV Organising the pedigree chart • Individuals in each generation are identified by Arabic numerals numbered from the left • Therefore the affected individuals are II3, IV2 and IV3 1 2 3 5 6 7 4
1 and 2 split after having 4, 2 then had kids with 3 and split with her too after 5-9 were born Genotypes of 1, 4,7? Genotypes of 2 & 3? Genotypes of 5,6, 8, 9, 10, 11, 12? What’s Going On? Shaded = Blue Eyes 3 2 1 9 6 5 8 4 10 7 11 12 In what generation are there twins?
Time to Practice… • Complete the practice worksheet on pedigrees in class in pairs (we will review) • Pedigree activity – you will be the geneticist trying to figure out the pattern of inheritance for different traits, disorders, or diseases.