Download

1 / 13
130 likes | 281 Vues
Overview of the FY 2005 CPIC Process for BY 2007 CPIC Cycle April 15,2005. Wendy Blake-Coleman For the National GIS Work Group Meeting. Major IT Investment Definition Under the CPIC Process. System or investment that:

E N D
Overview of the FY 2005 CPIC Processfor BY 2007 CPIC CycleApril 15,2005 Wendy Blake-Coleman For the National GIS Work Group Meeting
Major IT Investment Definition Under the CPIC Process System or investment that: • Requires special management attention because of its importance to Agency mission with significant program or policy implications • has high executive visibility • Is an integral part of the agency’s modernization blueprint (EA) • Directly tied to the top two layers of the Federal Enterprise Architecture (Services to Citizens and Mode of Delivery); • Was a major investment in the prior submission and is continuing • Defined as major by the Agency’s capital planning and investment control process (for EPA >=$3M annually). • For financial management and spends more than $500,000;
Business Case Paradigm Shift for BY 2007 Cycle In alignment with OMB’s direction, move towards a year round process which promotes good Project Management • Objectives • Incremental improvements throughout year • Early warnings on potential problems and forecast for additional resources • Help improve project success • Reporting • Year round • Quarterly - Sections to CPIC Team and Updates to IIS • Annually - Exhibit 300 to CPIC / IIS / OMB
CPIC Year Round Program April 15 June 3 July 15 Bus Case Train Bus Case Train OMB Bus Case Feedback Train • IA. Project Description • IB. Justification • IC. Performance Goals & Measures • IE. Alternative Analysis • IH. Project & Funding Feedback • ID. Program Management • IG. Acquisition Strategy • IF. Risk Management • IIA. Enterprise Architecture • IIB. Security & Privacy Feedback
Proposed National Geospatial Program Exhibit 300 Schedule • Key Dates: • 4/11: Internal Drafts due for Sections I.A, I.B, I.C, I.D, I.E, I.G • IA. Project Description • IB. Justification • IC. Performance Goals & Measures • ID. Program Management • IE. Alternative Analysis • IG. Acquisition Strategy • 4/15: eCPIC updates due for Sections I.A, I.B, I.C, I.D, I.E, I.G • 5/15: Internal Drafts due for Sections I.F, I.H, II.A, II.B • IF. Risk Management • IH. Project & Funding • IIA. Enterprise Architecture • IIB. Security & Privacy • 6/3: eCPIC updates due for Sections I.F, I.H, II.A, II.B • 7/1: Final Internal Drafts due for All Sections • 7/15: Final eCPIC draft updates required for All Sections • 8/10: Final changes due internally for All Sections based on Consultant feedback (estimated) • 8/15: Final eCPIC submissions due (estimated) • 9/1: Final transmission of eCPIC submissions toOMB (estimated)
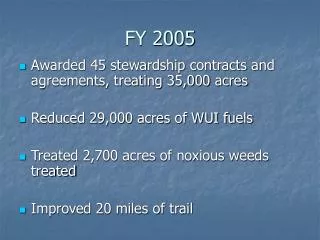
What’s Next for the Regional Coordinators • Reconciliation of FY 2005 cost estimates provided in early March with those pulled from BAS Version 8.1 on 4/1/05 • Adjustments to FY 2005 Exhibit 300 cost estimates or BAS cost estimates (if necessary) • Development of FY 2006 and FY 2007 Cost Estimates • Allocation of Regional costs to the 4 Regional Geospatial Milestones in the Exhibit 300
Reconciliation of March Cost Estimates and BAS-Entered Estimates • Many Regions’ BAS-entered FY 2005 cost estimates were significantly lower than expected based on the estimates provided in early March • Need to identify the areas where the BAS estimates deviated from earlier estimates, and by how much • FTE costs and numbers were 30% lower than expected • Contracts dollars were 40% lower than expected • The reasons for the variances can then be investigated in each Region through discussions with the Regional Comptroller Representatives that entered the FY 2005 GEO BAS data
Reconciliation of March Cost Estimates and BAS-Entered Estimates (continued) • Overall the net difference between the Regions’ March estimates for FY 2005 and the BAS-entered estimates was approximately $1.1 million out of a total projected budget of $7.29 million • This is a significant improvement over FY 2004; the net difference between Regional Exhibit 300 estimates and BAS actuals in FY 2004 was approximately $6.96 million out of a $8.51 million projected budget • Need to continue to investigate any remaining IT cost accounting coding issues and build upon the work done thus far in FY 2005 with the Regional Comptrollers
Adjustments to Exhibit 300 Cost Estimates or BAS Cost Estimates • Once issues have been identified, and causes for the variances are understood and documented, need to consider what changes are required for FY 2005 • BAS Adjustment • Exhibit 300 Adjustment • Correction efforts for FY 2005 will likely focus on major discrepancies/errors as opposed to smaller-scale differences • If variances are very slight/small, may just use BAS estimates for Exhibit 300 for FY 2005
Development of FY 2006 and FY 2007 Cost Estimates • Need to develop cost estimates for FY 2006 and FY 2007 this year for the Exhibit 300 and BAS • Past Exhibit 300 cost estimates for outyears were largely based on the current year budgets with an FTE increase factored in for inflation and mandatory pay raises • Consider how your Region’s GEO work/budgets will likely change in the outyears when devising your estimates • Dates for FY 2006 and FY 2007 BAS entry will be provided by OCFO in the near future; Exhibit 300 estimates will need to be submitted by 5/15 • Recommend using the same BAS Entry Preparation spreadsheets as in March for FY 2006 and FY 2007
Allocation of Regional Costs to Exhibit 300 Milestones • Just as in FY 2004, costs for each Region must be allocated to one of the 4 Regional milestones included in the Exhibit 300 • For each milestone, costs must be allocated from each of the 15 cost categories, by System Life-Cycle (SLC) Phase • An updated version of the spreadsheet used in FY 2004 will be provided to each Region as a means of collecting and reporting this information
Allocation of Regional Costs to Exhibit 300 Milestones (continued)
Questions? Wendy Blake-Coleman 202-566-1709 Blake-Coleman.Wendy@epa.gov Brendan Bowler 303-237-0044 Brendan_Bowler@sra.com