Introduction to Chromatography: Types, Principles, and Applications
260 likes | 303 Vues
Learn about chromatography, the separation technique with numerous applications in scientific fields. Delve into the history, importance, and principles behind chromatography. Explore different types and techniques, including liquid and gas chromatography. Understand how chromatography works, and its role in separating and identifying chemical compounds. Dive into classifications based on mobile and stationary phases, and the force of separation. Discover Thin Layer Chromatography (TLC), a quick and efficient method for substance identification and purity testing. Get practical insights on preparing the chamber, developing plates, visualizing compounds, and interpreting data. Enhance your knowledge and skills in chromatography under the guidance of Prof. Avinash P. Tupe.

Introduction to Chromatography: Types, Principles, and Applications
E N D
Presentation Transcript
Learning Outcomes 1. Define Chromatography. 2. State different types of chromatographic techniques. 3. Analyze the basic principle behind the phenomenon of chromatography 4. Apply the knowledge of chromatography in separation and identification of chemical compounds.
History Mikhail Tswett, Russian, 1872-1919 Botanist In 1906 Tswett used chromatography to separate plant pigments He called the new technique chromatography because the result of the analysis was 'written in color' along the length of the adsorbent column Chroma means “color” and graphos means to “write”
Importance Chromatography has application in every branch of the physical and biological sciences 12 Nobel prizes were awarded between 1937 and 1972 alone for work in which chromatography played a vital role
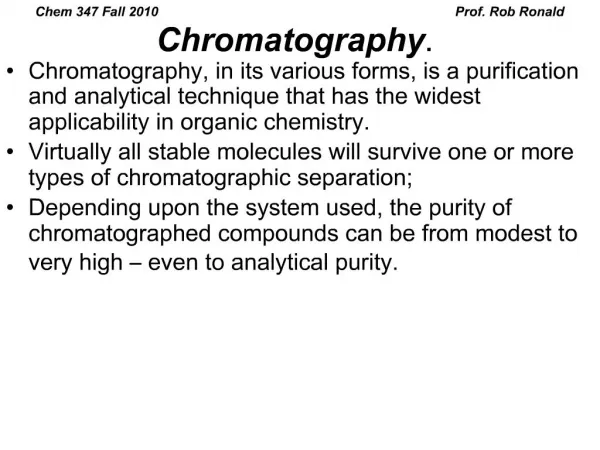
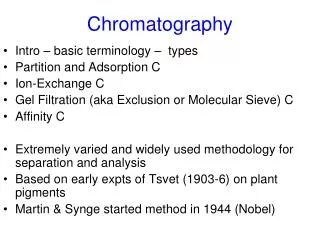
Chromatography is a physical method of separation in which the components to be separated are distributed between two phases one of which is stationary (stationary phase) while the other (the mobile phase) moves through it in a definite direction. The chromatographic process occurs due to differences in the distribution constant of the individual sample components.
Chromatography Is a technique used to separate and identify the components of a mixture. Works by allowing the molecules present in the mixture to distribute themselves between a stationary and a mobile medium. Molecules that spend most of their time in the mobile phase are carried along faster.
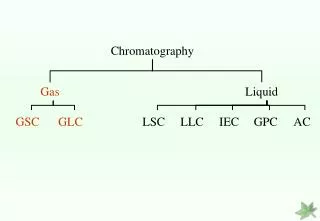
Classification of chromatography according to mobile phase: 1- Liquid chromatography: mobile phase is a liquid. (LLC, LSC). 2- Gas chromatography : mobile phase is a gas. (GSC, GLC).
Classification according to the packing of the stationary phase: 1- Thin layer chromatography (TLC): the stationary phase is a thin layer supported on glass, plastic or aluminium plates. 2- Paper chromatography (PC): the stationary phase is a thin film of liquid supported on an inert support. 3- Column chromatography (CC): stationary phase is packed in a glass column.
Classification according to the force of separation: 1- Adsorption chromatography. 2- Partition chromatography. 3- Ion exchange chromatography. 4- Gel filtration chromatography. 5- Affinity chromatography.
Thin layer chromatography (TLC) is a method for identifying substances and testing the purity of compounds. TLC is a useful technique because it is relatively quick and requires small quantities of material.
Separations in TLC involve distributing a mixture of two or more substances between a stationary phase and a mobile phase. The stationary phase: is a thin layer of adsorbent (usually silica gel or alumina) coated on a plate. The mobile phase: is a developing liquid which travels up the stationary phase, carrying the samples with it. Components of the samples will separate on the stationary phase according to how much they adsorb on the stationary phase versus how much they dissolve in the mobile phase.
Preparing the Chamber To a jar with a tight-fitting lid add enough of the appropriate developing liquid so that it is 0.5 to 1 cm deep in the bottom of the jar. Close the jar tightly, and let it stand for about 30 minutes so that the atmosphere in the jar becomes saturated with solvent.
Preparing the Plates for Development With a pencil, etch two small notches into the adsorbent about 2 cm from the bottom of the plate. The notches should be on the edges of the plate, and each notch should be the same distance up from the bottom of the plate. The notches must be farther from the bottom of the plate than the depth of the solvent in the jar. Using a drawn-out capillary tube, spot the samples on the plate so that they line up with the notches you etched.
Developing the Plates After preparing the development chamber and spotting the samples, the plates are ready for development. Be careful to handle the plates only by their edges, and try to leave the development chamber uncovered for as little time as possible. When the plates are removed from the chamber, quickly trace the solvent front (the highest solvent level on the plate) with a pencil.
Identifying the Spots (visualization) If the spots can be seen, outline them with a pencil. If no spots are obvious, the most common visualization technique is to hold the plate under a UV lamp. Many organic compounds can be seen using this technique, and many commercially made plates often contain a substance which aids in the visualization of compounds.
Visualizing Agents Alkaloids: Dragendorff’s reagent Cardiac glycosides: Antimony trichloride Sugar: Aniline phthalate Amino acids: Ninhydrin
Interpreting the Data The Rf (retention factor) value for each spot should be calculated. It is characteristic for any given compound on the same stationary phase using the same mobile phase for development of the plates. Hence, known Rf values can be compared to those of unknown substances to aid in their identifications.
(Note: Rf values often depend on the temperature and the solvent used in the TLC experiment. the most effective way to identify a compound is to spot known substances – authentic - next to unknown substances on the same plate.) In addition, the purity of a sample may be estimated from the chromatogram. An impure sample will often develop as two or more spots, while a pure sample will show only one spot
Summary A TLC plate is a sheet of glass, metal, or plastic which is coated with a thin layer of a solid adsorbent (usually silica or alumina). A small amount of the mixture to be analyzed is spotted near the bottom of this plate. The TLC plate is then placed in a shallow pool of a solvent in a developing chamber so that only the very bottom of the plate is in the liquid. This liquid, or the eluent, is the mobile phase, and it slowly rises up the TLC plate by capillary action. As the solvent moves past the spot that was applied, an equilibrium is established for each component of the mixture between the molecules of that component which are adsorbed on the solid and the molecules which are in solution.
In principle, the components will differ in solubility and in the strength of their adsorption to the adsorbent and some components will be carried farther up the plate than others. When the solvent has reached the top of the plate, the plate is removed from the developing chamber, dried, and the separated components of the mixture are visualized. If the compounds are colored, visualization is straightforward. Usually the compounds are not colored, so a UV lamp is used to visualize the plates.