1 / 3

Thierry DELCROIX ; LEGOS/IRD, Toulouse, France

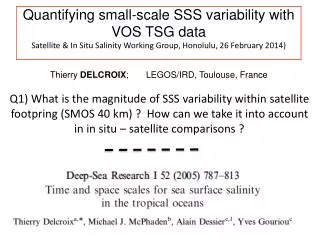
Quantifying small-scale SSS variability with VOS TSG data Satellite & In Situ Salinity Working Group, Honolulu, 26 February 2014). Q1) What is the magnitude of SSS variability within satellite footpring (SMOS 40 km) ? How can we take it into account in in situ – satellite comparisons ?.

waldo
Télécharger la présentation

Thierry DELCROIX ; LEGOS/IRD, Toulouse, France

An Image/Link below is provided (as is) to download presentation Download Policy: Content on the Website is provided to you AS IS for your information and personal use and may not be sold / licensed / shared on other websites without getting consent from its author. Content is provided to you AS IS for your information and personal use only. Download presentation by click this link. While downloading, if for some reason you are not able to download a presentation, the publisher may have deleted the file from their server. During download, if you can't get a presentation, the file might be deleted by the publisher.

E N D

Presentation Transcript


  1. Quantifying small-scale SSS variability with VOS TSG dataSatellite & In Situ Salinity Working Group, Honolulu, 26 February 2014) Q1) What is the magnitude of SSS variability within satellite footpring (SMOS 40 km) ? How can we take it into account in in situ – satellite comparisons ? Thierry DELCROIX; LEGOS/IRD, Toulouse, France

  2. The French Sea Surface Salinity Observation Service

More Related