Edge Detection in Biologically Inspired Vision Systems
Explore a unified framework for edge detection inspired by the Human Visual System. Discover a novel edge detector that computes edge visibility. Learn about filtering, thresholding, and gradient-based approaches. Previous works by Marr & Hildreth, Canny, and others are discussed, as well as the integration of contrast sensitivity functions and multi-scale detection methods. Enhance your understanding of biologically consistent vision systems and edge visibility mechanisms.

Edge Detection in Biologically Inspired Vision Systems
E N D
Presentation Transcript
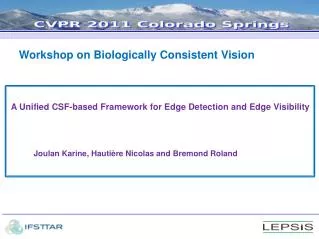
Workshop on Biologically Consistent Vision A Unified CSF-based Framework for Edge Detection and Edge Visibility Joulan Karine, Hautière Nicolas and Bremond Roland
Introduction IMAGE PROCESSING VISION SCIENCE Low vision ► A new edge detector is proposed which computes the edge visibility from the Human Visual System. ► Interests:
CONTENTS • Previous work • Framework • Results • Conclusion 3 3
1_Previous work 2_Framework 3_Results 4_Conclusion • CONTENTS • Previous work • Edge detection • Vision science • Framework • Results • Conclusion 4
1_Previous work 2_Framework 3_Results 4_Conclusion THRESHOLDING FILTERING DERIVATION Image 1 / Edge detection General procedure: • Edge detection is based on the use of derivatives (considered as a high-pass filter) • Filtering is useful to eliminate noise at a given scale • use a single band-pass filter • or several band-pass filters (multi-scale approach) . Edges detected 5 D. Ziou and S. Tabbone. A multi-scale edge detector. Pattern Recognition, 26(9):1305–1314, 1993. J.Canny. A computational approach to edge detection. IEEE Trans. on Pattern Analysis and Machine Intelligence, 8:679-698, 1986.
1_Previous work 2_Framework 3_Results 4_Conclusion D.Ziou and Al,1993 Feature-based classification J.Canny,1986 Coarse-to-fine F.Bergholm,1997 T.Lindeberg,1998 Fine_to_coarse Right local scale 1 / Edge detection In the litterature, different ways for multi-scale approach : • A multi-scale detector closer to human vision was proposed by Marr&Hildreth. D. Ziou and S. Tabbone. A multi-scale edge detector. Pattern Recognition, 26(9):1305–1314, 1993. J.Canny. A computational approach to edge detection. IEEE Trans. on Pattern Analysis and Machine Intelligence, 8:679-698, 1986. F.Bergholm. Edge focusing. IEEE Trans. on Pattern Analysis and Machine Intelligence, 9:726-741, 1987. T. Lindeberg. Edge detection and ridge detection with automatic scale selection. International Journal of Computer Vision, pages 117–156, 1998. D. Marr and E. Hildreth. Theory of edge detection. In Proceedings Royal Society London B, volume 207, pages 187–217, 1980. 6
1_Previous work 2_Framework 3_Results 4_Conclusion Slope computing Edge localization Edge amplitude Input Image Laplacian operator Gaussian filter Detecting zero-crossings An edge detector close to the human vision (Marr&Hildreth, 1980). • Description : • Multi-scale approach (opposite gaussian filters trying to mimic a receptive field of the HVS). • Laplacian of Gaussian (LoG) (second derivative) is used in order to detect edges at zero-crossing. • From the LoG slope, the edge amplitude is computed. • Marr’s model analysis for a single channel : • Enroth-Cugell&Robson’ theory state that DoG model are most appropriate to vision mechanism than LoG operator. • D. Marr and E. Hildreth. Theory of edge detection. In Proceedings Royal Society London B, volume 207, pages 187–217, 1980. • C. Enroth-Cugell and J. G. Robson. The contrast sensitivity of retinal ganglions cells of the cat. J. Physiol., 187:517–522, 1966. 7
1_Previous work 2_Framework 3_Results 4_Conclusion not visible visible Contrast sensitivity (1/contrast) [Barten, 1999] Spatial frequency (in cpd) 2/ Vision science The visibility of a human eye depends on the CSF (Contrast Sensitivity Function). The CSF can be : - normalised (sensor output, no luminance value ) - not normalised (luminance value ) P. Barten. Contrast Sensitivity Function and its effects on image quality. SPIE, 1999. J. L. Mannos and D. J. Sakrison. The effects of a visual fidelity criterion on the encoding of images. IEEE Transactions on Information Theory, 4:525–536, 1974. 3. F.Campbell and al. Application of Fourier analysis to the visibility of gratings. Journal of Physiology, 197:551-556, 1968. 8 8
1_Previous work 2_Framework 3_Results 4_Conclusion Objectives The framework proposed addresses the ability to mimic the HVS in its edge detection performance. For this, we improved Marr&Hildreth’s model. ► model of the CSF. ► multi-scale approach. ► edge detection. ► inspired by Marr’s model, edge visibility will be computed from the edge amplitude. ► new defintion of true and false edges : visible and invisible edges. ► visual adaptation. S. Daly. The Visible Differences Predictor: An Algorithm for the Assessment of Image Fidelity, pages 179–206. A. B. Watson Ed., Digital Images and Human Vision, MIT Press, Cambridge, MA, 1993. N. Hautiere and D. Aubert. Visibles edges thresholding: a hvs based approach. In Proc. IEEE International Conference on Pattern Recognition (IPCR), pages 155–158, Hong-Kong (China), 2006. 9 9
1_Previous work 2_Framework 3_Results 4_Conclusion • CONTENTS • Previous work • Framework • Visual adaptation • Band-pass filter • Edge detection • Edge visibility • Results • Conclusion 10
1_Previous work 2_Framework 3_Results 4_Conclusion Bandpass channel Bandpass channel Bandpass channel 2. Description of the proposedframework Multi-scale filter Visual adaptation Input Image (luminance) B A Edge detection Edge visibility C D Edge visibility Visible Edges 11
1_Previous work 2_Framework 3_Results 4_Conclusion 1/ Visual adaptation A For a given sensory channel at detection threshold, we have : This Gain feedback simulates visual adaptation : biological and optical sensors. visibility Gain feedback Image I2 Image I (luminance) G = 1/La La Adaptation Luminance Visual adaptation 12
1_Previous work 2_Framework 3_Results 4_Conclusion Bandpass channel Bandpass channel Bandpass channel 2/ Multi-scale Filter B Multi-scale filter Visual adaptation Input Image (luminance) B A Edge detection Edge visibility C D Edge visibility Visible Edges 13
1_Previous work 2_Framework 3_Results 4_Conclusion visible 2/ Multi-scale Filter B The CSF describes the visibility of sine gratings from the Contrast Sensitivity of a human observer. not visible Contrast sensitivity (1/contrast) [Barten, 1999] Spatial frequency (in cpd) 14 P. Barten. Contrast Sensitivity Function and its effects on image quality. SPIE, 1999. J. L. Mannos and D. J. Sakrison. The effects of a visual fidelity criterion on the encoding of images. IEEE Transactions on Information Theory, 4:525–536, 1974. 3.
1_Previous work 2_Framework 3_Results 4_Conclusion ON OFF ON/OFF cell with receptive field of a given size 2/ Multi-scale Filter B • Difference of Gaussians (DoG) was proposed in vision science as an analytic model of the receptive fields of X-cells. • Different receptive fields of a given size (sum of DoG, SDoG). where : I is the input image , Gσ is the normalized Gaussian operator with Standard Deviation σ, σ+ and σ− are the positive and negative parts of a DoG (σ− = λσ+), ω is its weight. C. Enroth-Cugell and J. G. Robson. The contrast sensitivity of retinal ganglions cells of the cat. J. Physiol., 187:517–522, 1966. B. Wandell. Foundations of vision. Sinauer associates, Sunderland, MA, USA, 1995. 15 15
1_Previous work 2_Framework 3_Results 4_Conclusion 2/ Multi-scale Filter B • With a sum of separated bandpass channel, we have a multi-scale operator Sum of DoG Contrast sensitivity (1/contrast) residue Spatial frequency (in cpd) Barten’s CSF with adaptative luminance La = 100 cd/m². • P. Barten. Contrast Sensitivity Function and its effects on image quality. SPIE, 1999. 16
1_Previous work 2_Framework 3_Results 4_Conclusion 3/Edge Detection C Multi-scale filter Bandpass channel Visual adaptation Input Image (luminance) Bandpass channel B Bandpass channel A Edge detection Edge visibility C D Edge visibility Visible Edges from HVS 17
1_Previous work 2_Framework 3_Results 4_Conclusion Bandpass channel = DoG Zero - crossings Input Image (luminance) Edge Detection A B C Visual adaptation 3/Edge Detection C • Even if a DoG is not stricly speaking a second derivative , it is close to a LoG operator (Marr&Hildreth, 1980 ) (a LoG is the limit of a DoG). • LoG and DoG both find the zero-crossings. Bandpass channel = DoG Bandpass channel = DoG Σ • The DoG is closer to the HVS than a LoG (Enroth-Cugell&Robson, 1966). • In our implementation, zero-crossings are found with 4 connexities. C. Enroth-Cugell and J. G. Robson. The contrast sensitivity of retinal ganglions cells of the cat. J. Physiol., 187:517–522, 1966. 18
1_Previous work 2_Framework 3_Results 4_Conclusion 3/Edge Detection C Input (luminance image) ΣDoG Edge localization Zero-crossing: transitions between positive (white) and negative (black) values. 19
1_Previous work 2_Framework 3_Results 4_Conclusion 4/Edge Visibility D Multi-scale filter Bandpass channel Visual adaptation Input Image (luminance) Bandpass channel B Bandpass channel A Edge detection Edge visibility C D Edge visibility Visible Edges from HVS 20
1_Previous work 2_Framework 3_Results 4_Conclusion constant K = Width / HFOV v = s / ω D 4/Edge Visibility ► Conversion of the DoG slope from pixels to degrees (CSF units ) ► Edgevisibility computed from Marr&Hildreth’s model. Marr &Hildreth describe the edgeamplitude at the zero-crossings as a directionalfirst derivative : So, with the slope measured on the zero-crossings (noticed s) , the edge amplitude (noticed v) is: • with : • HFOV : angular size of the image • ω : 2πf • f : frequency corresponding to the size of the filter D. Marr and E. Hildreth. Theory of edge detection. In Proceedings Royal Society London B, volume 207, pages 187–217, 1980. 21 21
1_Previous work 2_Framework 3_Results 4_Conclusion Input Image (luminance) DoG1 DoG2 4/Edge Visibility D Edge amplitude on x axis DoGn Zero-crossings Edge amplitude on y axis Σ Edge amplitude on x axis Slope modulus Zero-crossings Σ Edge amplitude on y axis Edge amplitude on x axis Zero-crossings Edge amplitude on y axis Visibility edge Edge localization D. Marr and E. Hildreth. Theory of edge detection. In Proceedings Royal Society London B, volume 207, pages 187–217, 1980. 22 22
1_Previous work 2_Framework 3_Results 4_Conclusion 4/Edge Visibility D 23 23
1_Previous work 2_Framework 3_Results 4_Conclusion Visible edges Multi-scale filter Bandpass channel Visual adaptation Input Image (luminance) Bandpass channel B Bandpass channel A Edge detection Edge visibility C D Edge visibility Visible Edges 24
1_Previous work 2_Framework 3_Results 4_Conclusion • CONTENTS • Previous work • Description of the framework • Results • Edge localization • Edge visibility • Conclusion 25
1_Previous work 2_Framework3_Results 4_Conclusion 1/ Edge localization ► The framework finds a linear step edge with a correct localization. ► Some localization error occur with junctions and corners. (artifacts are not visible by the HVS). 26
1_Previous work 2_Framework3_Results 4_Conclusion 2/ Edge visibility The input stimulus If, C, Mwas successively a sine wave and square gratings. f : spatial frequency (in cpd) M : mean luminance C : contrast (from the CSF) After the visual adaptation pre-processing, the visibility of the stimulus becomes If, C, 1 Dark_blue : Barten’s CSF (L=100 cd/m²) Blue : visibility of sine wave gratings Green : square gratings visibility Red : square gratings visibility with the ratio 4/π According to Campbell &Robson , the visibility of the square grating corresponds with the CSF with the ratio r = 4/π. ► The visibility of sine wave and square gratings are proportional to the CSF values. 27
1_Previous work 2_Framework3_Results 4_Conclusion 2/ Edge visibility (Ricco’s law) The visibility of small targets follows a Ricco’s law such as : A : object’s area Cs: visibility threshold The edge visibility of discs of various sizes were computed with a mean luminance M(M=100 cd/m²) and a contrast C (C=0.01) constant for all targets. ► Good approximation of Ricco’s law. 28
1_Previous work 2_Framework 3_Results 4_Conclusion • CONTENTS • Previous work • Description of the framework • Results • Conclusion 29
1_Previous work 2_Framework 3_Results4_Conclusion Summary : A unified framework is proposed , based on a simulation of the HVS, and computes the localization and the visibility of edges in an image. Improvements: Improve junctions and corners localization. Futur work : Validation of the model against observers, on realistic images. 30 R. Deriche and G.Giraudon. A computational approach for corner and vertex detection . International Journal on Computer Vision, 10:101-124, 1992. G. Lowe. Object recognition from local scale-invariant features. In Poceedings of the International Conference on Computer Vision, pages 1150–1157, Corfu (Greece), September 1999.
References • P. Barten. Contrast Sensitivity Function and its effects on image quality. SPIE, 1999. • M. Basu. Gaussians-based edge detection methods. A survey. IEEE Trans. on Systems, Man and Cybernetics, Part C, 32(3):252-260, 2002. • F.Bergholm. Edge focusing. IEEE Trans. on Pattern Analysis and Machine Intelligence, 9:726-741, 1987. • F.Campbell and al. Application of Fourier analysis to the visibility of gratings. Journal of Physiology, 197:551-556, 1968. • J.Canny. A computational approach to edge detection. IEEE Trans. on Pattern Analysis and Machine Intelligence, 8:679-698, 1986. • S. Daly. The Visible Differences Predictor: An Algorithm for the Assessment of Image Fidelity, pages 179–206. A. B. Watson Ed., Digital Images and Human Vision, MIT Press, Cambridge, MA, 1993. • R. Deriche and G.Giraudon. A computational approach for corner and vertex detection . International Journal on Computer Vision, 10:101-124, 1992. • C. Enroth-Cugell and J. G. Robson. The contrast sensitivity of retinal ganglions cells of the cat. J. Physiol., 187:517–522, 1966. • N. Hautiere and D. Aubert. Visibles edges thresholding: a hvs based approach. In Proc. IEEE International Conference on Pattern Recognition (IPCR), pages 155–158, Hong-Kong (China), 2006. • W. M. Ilhagga. The Canny edge detector revisited. International Journal of Computer Vision, 91(3):251- 261, 2010. • T. Lindeberg. Edge detection and ridge detection with automatic scale selection. International Journal of Computer Vision, pages 117–156, 1998. • J. L. Mannos and D. J. Sakrison. The effects of a visual fidelity criterion on the encoding of images. IEEE Transactions on Information Theory, 4:525–536, 1974. 3. • D. Marr and E. Hildreth. Theory of edge detection. In Proceedings Royal Society London B, volume 207, pages 187–217, 1980. • B. Wandell. Foundations of vision. Sinauer associates, Sunderland, MA, USA, 1995. • D. Ziou and S. Tabbone. A multi-scale edge detector. Pattern Recognition, 26(9):1305–1314, 1993. • G. Lowe. Object recognition from local scale-invariant features. In Poceedings of the International Conference on Computer Vision, pages 1150–1157, Corfu (Greece), September 1999.