Obesity Trends in the United States
460 likes | 517 Vues
Explore the rise of obesity from 1985 to 2009 through Body Mass Index (BMI) data collected by the CDC. Learn about body composition, healthy weight, obesity trends, impacts on lifespan, obesity in high school students, and health hazards. Discover methods to assess body fatness and the relationship between obesity and diabetes.

Obesity Trends in the United States
E N D
Presentation Transcript
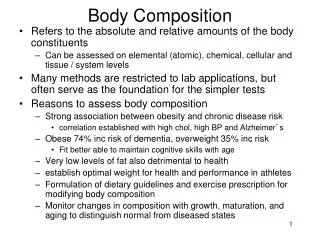
Unit 5: Body Composition and Weight ManagementOBJECTIVES FOR THIS UNIT: Students will: • 1) Understand the various components of body composition.2) Discuss how percent body fat is related to overall health.3) Describe healthy and unhealthy levels of body fat in high school students.4) Describe some methods of assessing body fatness, and discuss some "pro’s" and "con’s" of each method.5) Understand some health hazards of being overweight, and be introduced to eating disorders.
Assignment List • (Optional) Textbook Reading For Unit 5: • Chapter 13 (pages 220-241) • At the end of this lesson you will have completed the following assignments: • 05.02 – Activity Log 7 • 05.2.1 – Exercising with Weight Added05.3.1 - Determining Your Healthy Body Weight • 05.4.1 Unit 5 quiz • 05.4.2 Activity Log 8
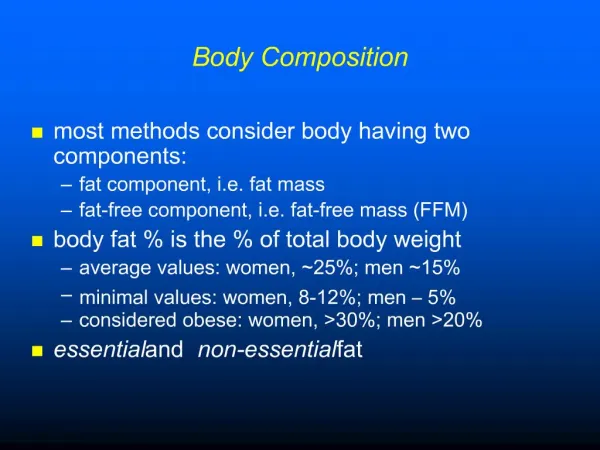
Obesity Trends Among U.S. Adults between 1985 and 2009 • Obesity is having a very high amount of body fat in relation to lean body mass, or Body Mass Index (BMI) of 30 or higher. • Body Mass Index (BMI) is a measure of an adult’s weight in relation to his or her height, specifically the adult’s weight in kilograms divided by the square of his or her height in meters.
The data shown in these maps were collected through CDC’s Behavioral Risk Factor Surveillance System (BRFSS). Each year, state health departments use standard procedures to collect data through a series of monthly telephone interviews with U.S. adults. Prevalence estimates generated for the maps may vary slightly from those generated for the states by BRFSS (http://aps.nccd.cdc.gov/brfss) as slightly different analytic methods are used. Obesity Trends Among U.S. Adults between 1985 and 2009
US Body Composition Rates • The below slides indicate the rise of obesity within the United States from 1985 to 2009. Each US state indicates a BMI level of 30 or greater, or individuals who are at least 30 lbs. overweight in that particular state. BMI levels range from: • (0-No Data to greater than 30%) in certain states. • Obesity is having a BMI of 30 or higher. The following map images are from the CDC, public domain
Obesity Trends* Among U.S. AdultsBRFSS, 1985 (*BMI ≥30, or ~ 30 lbs. overweight for 5’ 4” person) No Data <10% 10%–14%
Obesity Trends* Among U.S. AdultsBRFSS, 1991 (*BMI ≥30, or ~ 30 lbs. overweight for 5’ 4” person) No Data <10% 10%–14% 15%–19%
Obesity Trends* Among U.S. AdultsBRFSS, 1997 (*BMI ≥30, or ~ 30 lbs. overweight for 5’ 4” person) No Data <10% 10%–14% 15%–19% ≥20%
Obesity Trends* Among U.S. AdultsBRFSS, 2000 (*BMI ≥30, or ~ 30 lbs. overweight for 5’ 4” person) No Data <10% 10%–14% 15%–19% ≥20%
Obesity Trends* Among U.S. AdultsBRFSS, 2003 (*BMI ≥30, or ~ 30 lbs. overweight for 5’ 4” person) No Data <10% 10%–14% 15%–19% 20%–24% ≥25%
Obesity Trends* Among U.S. AdultsBRFSS, 2006 (*BMI ≥30, or ~ 30 lbs. overweight for 5’ 4” person) No Data <10% 10%–14% 15%–19% 20%–24% 25%–29% ≥30%
Obesity Trends* Among U.S. AdultsBRFSS, 2009 (*BMI ≥30, or ~ 30 lbs. overweight for 5’ 4” person) No Data <10% 10%–14% 15%–19% 20%–24% 25%–29% ≥30%
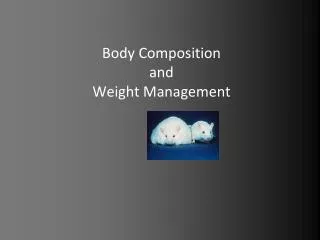
Obesity Trends* Among U.S. AdultsBRFSS,1990, 1999, 2009 (*BMI ≥30, or about 30 lbs. overweight for 5’4” person) 1999 1990 2009 No Data <10% 10%–14% 15%–19% 20%–24% 25%–29% ≥30%
Statistics: America: 60.1 % of adults are overweight or obese 23.4% are obese In Utah: 58.4% of adults are overweight or obese 21% percent are obese 103% increase nationally in past 14 years 112% increase in Utah in past 14 years
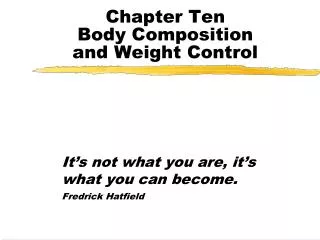
Excess Body Weight and Reduction of Lifespan Years of diminished lifespan [ie, a person with a BMI of 34 is likely to live five years less than a person with a BMI of 25] Body Mass Index Image from Wikimedia Commons: Peter Forster, Creative Commons Attribution 3.0 Unported license
Obesity and Diabetes: • Using the most accurate data available, it is estimated that 36% of all children born in the year 2000 will become diabetic sometime in their lives; among Hispanics, 50% will become diabetic. Image from Wikimedia Commons, Robert Lawton, Creative Commons Attribution-Share Alike 2.5 Generic
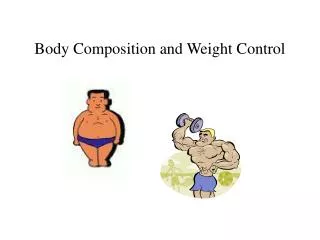
Estimated lifetime risk of developing diabetes for individuals born in the United States in 2000 Narayan et al, JAMA, 2003
Diabetes and Reduction in Lifespan -14.3 yrs -11.6 yrs JAMA 2003;290:1884-1890
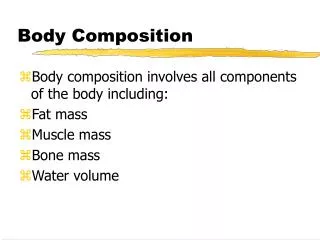
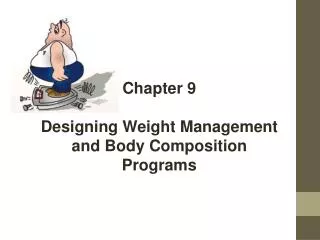
Body Composition &Weight Management • Body Composition is the makeup of body tissues, including muscle, bone, body fat, and all other body tissues. • Lean Body Mass is muscle tissue and other non-fat tissue such as bones, skin, body organs, ligaments and tendons. This is normally about 75-85% of our weight. • Fat Mass is the amount of fat in our body. This is normally about 15-25% of our weight.
The Term: Obesity • Obesity is the condition of being very over-fat or having a high percentage of body fat (Approx. 35% for women, 30% for men.)
What should my body fat be? • For men, essential body fat makes up about 3% of total body weight. For women, the percentage is higher - about 12% - because it includes amounts in the breasts, pelvis, hips and thighs believed necessary for normal female reproductive function. • Men should have a body fat of 10-20% to be in a healthy range. Men can have less than 10% and still be healthy. • Women should have a body fat percentage of 15-25%.Girls who are below this range may begin to have health issues and may stop menstruation.
Ideal Body Weight: • Ideal body weight is how much you should weigh if you had an appropriate amount of body fat. Runner image from Ookaboo, Wikimedia Commons, Lepax, Creative CommonsAttribution-Share Alike 2.0 Generic; Parade image from Wikimedia Commons, NARA, public domain
Body Fat in Women • Women tend to have more body fat than men—about 5% more. By nature, a woman's body is developed to protect her and a potential fetus. As a result, women have more enzymes for storing fat and fewer enzymes for burning fat. Additionally, the estrogen women have activates fat-storing enzymes and causes them to multiply. • The minimum percent body fat considered safe for good health is 12-14% for females. The average adult body fat is closer to 22%-25% for women. Image from Wikimedia Commons, Renoir, public domain
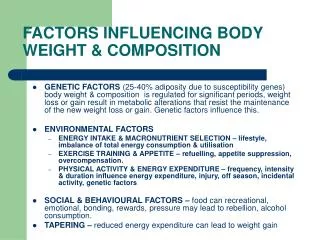
Factors that Influence Body Fatness: • Heredity • Metabolism • Diet/High sugar intake • Lack of physical activity • Early fatness – Last month of fetal development, or 1st year of life. • TV / Lifestyle-About 38.2 percent of Utah public high school students watch three or more hours of television per day on an average school day.
How do I Find my Body Fat Percentage? There are several methods one can use to determine body fat percentage: • Underwater/Hydrostatic Weighing • BOD POD • Electrical Impedance • Skin Calipers • Girth Measure/Body Circumference • Waist to Hip Ratio • Body Fat Scale • BMI
Underwater/Hydrostatic Weighing • Underwater weight is the best and most accurate measurement for body fat. • Advantages: Underwater weighing is the most widely used test of body density and in the past was the criterion measure for other indirect measures. • Disadvantages: The equipment required to do underwater weighing is expensive. The tanks are mostly located at university or other research institutions, and there is generally not easy access for the general population.
The BOD POD • The BOD POD Body Composition Tracking System uses patented Air Displacement Plethysmography for determining percent fat and fat-free mass in adults and children. The simple, five-minute test consists of measuring the subject's mass (weight) using a very accurate electronic scale, and volume, which is determined by sitting inside the BOD POD chamber. From these two measurements, the subject's body composition is calculated.
Electrical Impedance What is the Bioelectrical Impedance Method? Muscles, blood vessels and bones are body tissues having a high water content that conduct electricity easily. Body fat is tissue that has little electric conductivity. The Analyzer sends an extremely weak electrical current of 50 kHz and 500µA through your body to determine the amount of fat tissue. This weak electrical current is not felt while operating the Body Fat Analyzer. The Bioelectrical Impedance Method safely combines the electric resistance with the distance of the electricity conducted.
Skin Calipers • Calipers work by pulling subcutaneous fat (fat directly under the skin) away from the muscle with the tongs situated at their ends. Several predetermined sites are measured by a gauge that records the thickness of the pinch created by the tongs. An equation can be used to determine body-fat percentage, or the skin-fold thicknesses, on their own, can be used to gauge progress. • Men – Chest, Abdomen, Thigh • Women – Triceps, Waist, Thigh
Girth and Body Circumference • Girth measurements are circumference measurements taken at a specific body site and recorded. They are converted to a constant and then entered into a formula to predict percent body fat. The sites measured differ depending on a person's age and gender. • For ages 18 to 26: Men measure the right biceps, right forearm, and abdomen. • Women measure the abdomen, right thigh and right forearm. Image from Wikimedia Commons, Ron Mahon, Creative CommonsAttribution 3.0 Unported
Waist Circumference • Measuring waist circumference helps screen for possible health risks that come with overweight and obesity. If most of your fat is around your waist rather than at your hips, you’re at a higher risk for heart disease and type 2 diabetes. This risk goes up with a waist size that is greater than 35 inches for women or greater than 40 inches for men. Image from Wikimedia Commons, Aspen04, Public domain
Waist to Hip Ratio • Waist to Hip Ratiois one way to determine your health risk. In addition to measuring your waist, measure your hips at the widest part. Divide your waist measurement by your hip measurement. • For women a ratio of 0.80 is safe. • For men a ratio of 0.90 is safe. • For both men and women, a 1.0 or higher is considered “at risk”, or in the danger zone for undesirable health consequences, such as heart disease.
Body Fat Scale • Professional body fat monitors measure weight, body fat percentage, hydration level, lean body mass, BMI (body mass index) and more. A convenient printer, available with most professional body composition analyzers, makes it simple to update patient or client records with current data.
BMI – Body Mass Index • Obesity and overweight are commonly defined in terms of the body mass index (BMI). **BMI is calculated using a person’s height and weight. **BMI = weight (lbs) x 703/height squared (in2) (In Adults) • BMI of 18.5 to 24.9 is considered to be ideal, and anything above this is defined as overweight. A BMI greater than or equal to 30 is defined as obese. • Visit the website below to calculate your BMI: • http://www.nhlbisupport.com/bmi/
Health Hazards and Obesity • Breathing Difficulties • Diabetes • Cancer (many types) • High Blood Pressure • Heart Disease/Stroke • Kidney Disorders • Shorter Life Span • Pregnancy Problems in women • Arthritis • Hypertension • High Cholesterol • Sleep Apnea • Respiratory Problems • Surgical Risk • Prone to infections • Social Discrimination
Healthy Weight Loss • One should try to lose weight by doing it in a healthy way. Exercise and a healthy diet are the best way to reduce body fat. • Include a weight training program to help stimulate the metabolism.
Can you lose fat in just one area? • There is no such thing as spot reduction. You can’t just lose fat on your hips, back, or stomach. As you exercise and eat right, fat will decrease all over your body, not just in one particular spot.
Fad Diets and Weight Loss Gimmicks Don’t Work!!! • The world has an unhealthy obsession with 'fad' diets. This is due to the American culture's need for a magic bullet or solution that provides immediate gratification. Technically, a diet simply refers to what you eat each day. In the truest sense, we are all on a diet daily - the question is, is it healthy or not? • Another drawback of fad diets is that many of them don't work at all. Some, such as those based on diuretic herbs, simply cause a loss of water rather than fat. This water is simply regained back by the body and is then retained with a vengeance after you are off the diet. This is known as rebound weight gain. • Diets fail because they offer no long-term solution. http://www.healthstatus.com/articles/Weight_Loss_Fads_that_Don_t_Work.html
Set Goals, Eat Healthy and Exercise • No matter what the reason, successful weight loss and healthy weight management depend on sensible goals and expectations. If you set realistic goals for yourself, chances are you'll be more likely to meet them and have a better chance of keeping the weight off. In fact, losing even 5 to 10 percent of your weight is the kind of goal that can help improve your health. Most overweight people should lose weight gradually. For safe and healthy weight loss, try not to exceed a rate of 2 pounds per week. Sometimes, people with serious health problems associated with obesity may have legitimate reasons for losing weight rapidly.
Key Vocabulary • Bioelectric Impedence Analysis (BIA)is a technique based upon the principle that electrical currents travel faster through water. Therefore, if a person receives a small electrical current in their arms or legs (cylinder-shaped areas of the body), individuals with more muscle will have faster conductance (or current travel) rates. • Bod Podis a very new device that uses air displacement to estimate percent body fat.Body Compositionis defined as the various fat and nonfat components of your body.Body Mass Index is known as BMI and examines weight in proportion to height in an index (kg/m2 ). • Fat Mass is adipose tissue (fat) • Girth Measurements are techniques whereby you measure the width or girth of various body parts (e.g., upper arm, hip, waist, and wrist) and plug the circumferences into a formula, and your body composition is estimated. • Ideal Body Weight means how much you would weigh if you had an appropriate percent of body fat.
Key Vocabulary Continued • Lean Body Massconsists of parts of the body such as connective tissue, muscle, bone, and organs. • Obesity is a condition in which a person has high percentage of body fat. • Overweight - People considered to be overweight exceed their desirable bodyweight by 10% according to height and weight charts.Skinfold Calipersare used to measure skinfolds at various sites; because at least 1/2 of the body's tissues are subcutaneous, we can assume that a certain width of skinfold tissue equates to an overall percent body fat value. • Underwater or Hydrostatic Weighing is the “gold standard” by which all other techniques are compared, is a technique that requires subjects to exhale as forcefully as possible to minimize air bubbles, and then submerge themselves on an underwater scale.Waist Circumferenceis a more current technique where by the circumference of the waist, at the widest point from the side view, is used to estimate health risk. • Waist-to-Hip Ratiois a ratio obtained by dividing the circumference of the waist (at the umbilicus) by the circumference of the hips (at the widest point from the side view).