Download
1 / 24
240 likes | 379 Vues
An investigation of slow-moving East Coast Winter Storms during the past 55 years. Jase Bernhardt Northeast Regional Climate Center Cornell University. Why study slow-moving ECWS?. East Coast Winter Storms (ECWS) wreak havoc on the people and infrastructure of the eastern seaboard.

E N D
An investigation of slow-moving East Coast Winter Storms during the past 55 years Jase Bernhardt Northeast Regional Climate Center Cornell University
Why study slow-moving ECWS? • East Coast Winter Storms (ECWS) wreak havoc on the people and infrastructure of the eastern seaboard. • Oft overlooked is storm surge and coastal flooding that results, especially when these storms last over multiple tidal cycles. • Examples: February 23, 2003 storm (Fast) and December 7, 2003 storm (Slow).
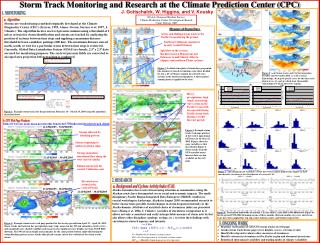
Fast vs. Slow Storms (Tidal cycles) • The top image shows the faster ECWS while the lower image is the slower ECWS. • There are substantial differences between the two types of storms. • Tide gauge information is from the NOAA Center for Operational Oceanographic Products and Services
Methodology • Exclusively used storms found in the Hirsch (2001) study- as well as an update which tracked storms through early 2006. • Potential storms were identified in the dashed box, but all storms had to fall within the solid box during at least two six-hourly periods. • Three other criteria also had to be met: • Closed circulation criterion • Movement criterion • Wind speed criterion
Methodology • Utilized data from the Hirsch study and update along with an automated program to develop speed for each storm at all six-hourly points. • Speed determined by movement between 2.5 X 2.5 degree points each period. • Calculated the average, minimum, and maximum speed for each storm. • Also extended these calculations to monthly, seasonal, and yearly averages.
Initial Results • Initial results followed what would be climatologically expected.
Initial Results • Monthly average storm speed also showed a clear, predictable trend, as early and latter portions of the season see weaker storms. • Middle months sustained higher average speeds despite more storms. • Will come back to this table soon as results are looked at in more detail.
ENSO + ECWS • Previous studies including Hirsch and my own work have concluded that El Niño years have more East Coast Winter Storms. • No such connection exists for storm speed and ENSO, however. • During El Niño years more southern storms form, but there is little correlation between latitude of origin and storm speed.
Origin + ECWS • Longitude of origin did seem to show a connection to storm speed. • Of the 13 months with the western most origins, 12 featured faster than normal storms. • All 13 of these months (including March 1993) also featured south of average origins.
Upper Air Pattern + ECWS • A distinctive upper air pattern accompanied fast and slow storm months, specifically heights at 500 mb and zonal wind at 300 mb. • These patterns held up when looking at multiple fast/slow months as well. • Significant deviations from climatological norms were also present during these months.
Upper Air Pattern + ECWS • 500 mb height pattern for slow (left) and fast (right) storm months.
Upper Air Pattern + ECWS • 300 mb zonal wind pattern for slow and fast storm months.
Upper Air Pattern + ECWS • 300 mb zonal wind anomalies.
Upper Air Pattern + ECWS • 500 mb heights anomalies.
NAO + ECWS • Going back to month vs. speed, the monthly speed trend matches up with the monthly NAO trend. Pressure (Azores High) – Pressure (Icelandic Low) NAO Data: Dr. Sultan Hameed, Stony Brook
NAO + ECWS • Unlike ENSO, NAO has a significant correlation with ECWS storm speed. • 17 of the top 20 fastest storm speed months were NAO positive. • Meanwhile, 9 of the top 10 most negative NAO months had below average storm speed. • NAO positive months also often shared the upper air pattern signature with fast months. • This was not as common for NAO negative and slow months, however.
Case Study- Late February 2010 Storm • All of the elements for an extremely slow moving ECWS came together for the final storm of the 2009/2010 season. • Very negative NAO the entire season. • The Upper Level wind pattern matched that of slow-moving storm months. • Result-robust snowfall amounts for much of the Northeast!
NAO • The entire 2009/2010 season saw negative NAO coupled with El Niño conditions. • The subtropical jet was active, while a blocking high persisted. • This led to many storms, which generally moved slowly. • The NAO Index for February 2010 was -1.98.
500 mbheights pattern, Feb 25-28 • 500 mb trough pushed well to the south of the Northeast. • Upper level low over Northeast = weak steering.
300 mb zonal wind pattern, Feb 25-28 • Bull's-eye of weak/NEGATIVE winds over the Northeast and New England. • Hence, the surface low moved slowly and then retrograded once inland.
Results • The surface low tracked up the east coast February 25, and stalled out near New York City on the 26th. • Then, the system, moved inland and retrograded on February 27th. • The low occluded and weakened over New York State on February 28th. • Snowfall amounts were considerable over a large swath of this region.
Upcoming Work • Delve further into the statistical “grunt work.” • Look at the upper air pattern and storm speed connection in more detail. • Ascertain how much stock can be placed in the longitude of origin vs. speed connection. • Apply to weather forecasting issues. Questions ?