Transition
Explore the complexities of economic transition, focusing on market intervention and state ownership. Learn about different economic systems, transition paths, costs, and reform strategies such as "big bang" and "gradual" approaches.

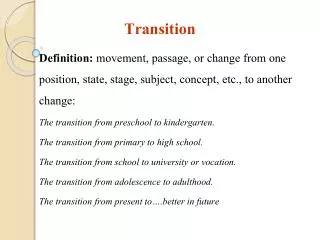
Transition
E N D
Presentation Transcript
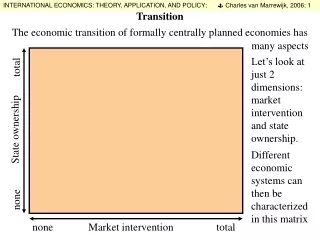
The economic transition of formally centrally planned economies has many aspects Transition Let’s look at just 2 dimensions: market intervention and state ownership. total State ownership Different economic systems can then be characterized in this matrix none none Market intervention total
At one hypothetical extreme we have capitalism, without state ownership or market intervention communism capitalism Transition total At the other extreme communism with total state ownership and total government control. State ownership none none Market intervention total
N. Korea Cuba USA communism capitalism Transition No country in the world fits in either extreme description. Even the USA has a public sector spending 30% of GDP total State ownership Even North Korea and Cuba have private production and incentives. none none Market intervention total
Market socialism? N. Korea Cuba USA communism capitalism Welfare state capitalism Transition Note that other hypothetical extremes are also possible. A country in transition is changing the mix of state ownership and market intervention in the medium run. total State ownership From the same initial position many different paths are possible. none none Market intervention total
Note also that privatisation is one-dimensional, while transition has more dimensions. Market socialism? N. Korea Cuba privatisation USA communism capitalism Welfare state capitalism Transition total If we would place Holland in this figure and characterize its path over the last 15 years it would look somewhat like this State ownership Holland Holland Holland Holland Holland Holland none none Market intervention total
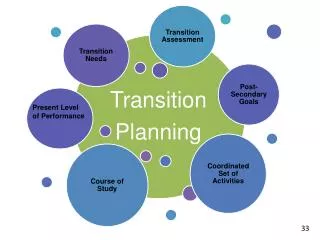
Transition, a second “J-curve” The multidimensional character of transition, the differences in initial positions, the differences in transition mix and speed of privatization and deregulation make it easy to understand why different countries have widely varying transition experiences. Transition involves a series of steps at the institutional, micro-economic and macroeconomic level. Inevitably, adjustment requires a reallocation of capital, services and labor between sectors of the economy, leading to an initial phase of decline in production. • There are two strategies of reform: • the “big bang” approach, achieving necessary steps of transition in a short period of time, leading to large initial declines of production (Poland is the prime example) • the “gradual” approach, trying to systematically sequence the steps to be taken and minimize transition pain and output loss (successor states of the former Soviet Union).
Transition, a second “J-curve” Poland used the “big bang” strategy. It started to recover quite quickly; this strategy seems to have worked better than the gradual approach.
Let’s look At these costs using a neoclassical framework and our knowledge of the construction of statistics. market goods planned goods Transition, the costs The transition process is estimated to lead to huge costs. We draw a ppf for a transition country. On the axes we put “market goods” versus “planned good”. The economy produces a lot of planned goods at P0 P0
If the transition process is complete the economy will produce a new output mix, such as P2. Transition, the costs The transition process brings the economy from production point P0 to P2. market goods How long it takes, and how it evolves we cannot say; here we have drawn a possibility. P2 Production point P1 is reached after some time. P1 P0 planned goods
Transition, the costs How do we measure the loss in output resulting from the transition? Statisticians use the prices at P0 to estimate the fall in production. market goods Clearly, the estimated production loss at P1 compared to P0 is substantial. P2 P1 P0 planned goods
Transition, the costs Remember that the initial production point P0 was not optimal. After the transition process is complete the production point P2 should represent true preferences. market goods P2 Using P2 prices there is no production loss at P1 relative to P0. Using preferences there is actually a welfare gain. P1 P0 The estimated loss is exaggerated. planned goods