Download
1 / 18
180 likes | 316 Vues
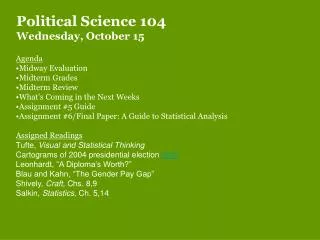
Political Science 104 Wednesday, October 15. Agenda Midway Evaluation Midterm Grades Midterm Review What’s Coming in the Next Weeks Assignment #5 Guide Assignment #6/Final Paper: A Guide to Statistical Analysis Assigned Readings Tufte, Visual and Statistical Thinking

E N D
Political Science 104 Wednesday, October 15 • Agenda • Midway Evaluation • Midterm Grades • Midterm Review • What’s Coming in the Next Weeks • Assignment #5 Guide • Assignment #6/Final Paper: A Guide to Statistical Analysis • Assigned Readings • Tufte, Visual and Statistical Thinking • Cartograms of 2004 presidential election (link) • Leonhardt, “A Diploma’s Worth?” • Blau and Kahn, “The Gender Pay Gap” • Shively, Craft, Chs. 8,9 • Salkin, Statistics, Ch. 5,14
Midway Evaluations Please take the rest of the class time to fill out the evaluations I’ve handed out. These are exactly like the final evaluations after class and they are my opportunity to re-calibrate how I teach these sections. Please use the back of the slip to write down any additional comments or suggestions that you may have. If you have any ideas about things we should do in section, please let me know! Midterm Grades A 87-100 B 75-86 C 60-71 C-/D 50-59 F <50
Question 1. Talk about research and the scientific method and compare it to other forms of knowledge. 1) Distinguish “empirical” from “normative”; 2) explain “verification” and “prediction”; 3) distinguish between knowledge that is “probablistic” and “certain” • Question 2. • What is the best level of measurement? • What measure of central tendency and dispersion would you use? • How would the values change if we enriched this variable?
Dispersion Central Tendency Shape
Midterm Grades If you didn’t get the grade that you wanted, remember a few things: • This test was a lot more difficult than any other regular Political Science exam. • The average was around 5-10 points lower than an “average” PS class. • There was about a 10 point curve on this test. • At this point, only 35% of your grade has been determined. You can still turn it around! • This class has actually performed BETTER than previous years 104 classes. As a whole, you guys did well. • If you do better on the final than the midterm, you’ll be awarded with an extra bump on your final grade. • Please come see me if you EVER feel uncomfortable with any of the material or if you don’t understand something. I am here to help you guys and I want you guys to do well!
Assignment #5 • What is the question motivating this research? Can you formulate the (implicit) normative theory about the gender pay gap? What is the key (dependent variable) concept? • How have the authors measured that concept? How and why does the measurement change as the analysis progresses? • Enumerate the alternative explanations (“hypotheses”) they give for the gender pay gap, and explain the causal mechanism for each. • What questions are left unanswered at the end of the article? Suggest some ideas for collecting the information needed for answering those questions.
Assignment #5 • How have the authors measured that concept? How and why does the measurement change as the analysis progresses? • ================================================================ • The article looks at the gender gap. • What is the gender gap? • To formulate the normative theory about the gender pay gap, brainstorm the various reasons as to why the gender pay gap actually occurs. This isn’t listed in the article. It’s implicit. • What is the key dependent variable? Take a look at the relationship they are examining. They are testing a number of potential different causes of an outcome. What is that outcome? What is the idea behind that outcome? (Don’t make this harder than it really is.)
Assignment #5 • How have the authors measured that concept? How and why does the measurement change as the analysis progresses? • Enumerate the alternative explanations (“hypotheses”) they give for the gender pay gap, and explain the causal mechanism for each. • ================================================================ • How are the authors actually measuring the dependent (outcome) variable? A measurement is the variable in which you can actually observe a change. How is the measurement changing? Why is the measurement changing? • The article lists a couple of different ways that explain the gender gap now that the landscape of the issue has become much more complicated and unclear. What are the “hypotheses” for these? (A hypothesis has both a cause and effect. ie. This x variable is causing a change in this y variable. Causal Mechanism: X changes Y because…
Assignment #5 • What questions are left unanswered at the end of the article? Suggest some ideas for collecting the information needed for answering those questions. • ================================================================ • What are some of the questions that the authors leave unanswered near the end of the article. • Identify these questions. • Take the view of a social scientist, and come up with a couple of ways to turn these questions into potential testable hypotheses. (ie., It really might be this x variable that is affecting the gender gap.) To come up with ideas for collecting information, you probably want to think of the appropriate concepts and potential measures of that hypothesis. You should make these variables up and brainstorm ways of how to actually collect them.
Assignment #6: A Guide to Statistical Analysis • At this point in the course, you should have a couple of things ready in your paper: • Some sort of testable hypothesis with both a cause and effect. • (I hypothesize that this might affects something else.) • (ie., I hypothesize that wealth affects voter participation.) • Have extracted the concepts from your hypothesis. (Don’t overcomplicate.) I hypothesize that wealth affects voter participation. CONCEPTS: WEALTH VOTER PARTICIPATION • Think of some way to operationalize (measure) these concepts: CONCEPTS: WEALTH VOTER PARTICIPATION income, net worth voter turnout, times worked on campaign
Assignment #6: A Guide to Statistical Analysis • Univariate Analysis • We use univariate analysis to only look at one variable. For example, if we want to examine income to see if there’s anything strange going on in that variable, we would look at the descriptive statistics (mean, median, mode, standard deviation, variance, range). • Bivariate Analysis • When we compare two variables, we want to use bivariate analysis. There are multiple types of bivariate analysis. • Multivariate Analysis • When we are looking at more than two variables, we want to use multivariate analysis. This is when we use regression models and introduce how to control. • Dichotomous Variables • Refers only to one variable. This one variable only has two categories. For example, gender is often classified a dichotomous variable (male or female). • Continuous Variables • A variable for which any value is possible. • Nominal Variable: Variables that can be placed in categories that can’t be ordered. • Ordinal Variable: Variables that can be ordered, but we can’t tell the difference between values. • Interval Variable: Variables in which the difference in variables are meaningful.
Assignment #6: A Guide to Statistical Analysis Descriptive Statistics: When Do We Use This:We use descriptive statistics when we have one variable, no matter the level of measurement. What Does It Do: This tells SPSS to calculate the mean, median, mode, standard deviation, variance, range, minimum, maximum and frequency tables for your variable. Why Do We Use It? To check to see how our variable looks in our data before we put it in our analysis. How Do We Do It? Analyze -> Descriptive Statistics -> Frequencies Calculating a Chi-Square: When Do We Use This:We use chi-square when we have one variable, no matter the level of measurement. What Does It Do: This tells SPSS to calculate our chi-square coefficient. Why Do We Use It? To check to see how if our variable acts differently than how we expect it to by chance. If It is zero, then we accept the null. How Do We Do It? Analyze -> Nonparametric Tests -> Chi-Square
Assignment #6: A Guide to Statistical Analysis Crosstabs When Do We Use This:We use crosstabs when we have two ordinal variables. What Does It Do: SPSS will generate a table that will cross tabulate the frequencies of the different categories in your variables. Why Do We Use It? To estimate the relationship between two variables. This is like doing a scatterplot, just with results. How Do We Do It? Analyze -> Descriptive Statistics -> Crosstab Calculating Gamma: When Do We Use This:We use gamma when we have two ordinal variables. What Does It Do: This performs a calculation in SPSS (which we went over in class yesterday) that checks to see if our relationship is significant. Why Do We Use It? To check to see if there’s a relationship between two ordinal variables. Gamma runs from -1 to 1 and we also look at the significance. How Do We Do It? Analyze -> Descriptive Statistics -> Crosstab (Click on Statistics)
Assignment #6: A Guide to Statistical Analysis Calculating a T-Test: When Do We Use This:We use a t-test when we have two or more variables. Usually, we’re comparing groups based on a dichotomous variable (independent)on a continuous variable (dependent). Although your independent can also be continuous. What Does It Do: A t-test finds out if there was a difference in the average means of one group versus another and finds the significance of that relationship. Why Do We Use It? To check to see how two variables relate to each other. If two groups significantly differ from each other, than that relationship is significant. How Do We Do It? Analyze -> Compare Means -> Independent Samples T-Test Regression: When Do We Use This:We use regression when we have two interval variables. What Does It Do: Regression finds the regression by plotting the two variables on a scatterplot and finding the slope of a line between two variables. Why Do We Use It? To see if there’s a relationship between our two interval level variables. How Do We Do It? Analyze -> Regression -> Linear
Assignment #6: A Guide to Statistical Analysis Boxplots: When Do We Use This:We use boxplots to when we have either one or two variables. Boxplots should only be used with interval variables, although this varies. What Does It Do: This tells SPSS to calculate descriptive statistics visually. Why Do We Use It? It is a visual representation of our descriptive statistics when we have one variable. It also tells us the relationship between two variables. How Do We Do It? Graphs -> Interactive -> Boxplot Scatterplots/Dot Graphs: When Do We Use This:We use scatterplots and dot graphs for two interval level variables. What Does It Do: This tells SPSS to plot the values of one variable against another on a X-Y graph. Why Do We Use It? This is a visual representation of a regression. It tells us the relationship between two interval variables. How Do We Do It? Graphs -> Interactive -> Scatterplot
Question? What about nominal variables? If you have a nominal variable, that’s fine. However, you need to be careful. You can’t really tell much from comparing two nominal variables to each other, so if you have two nominal variables, you may want to reconsider your variables. Also, since we can’t order the categories on a nominal variable, having it as your dependent variable doesn’t make too much sense empirically. The data can’t tell you anything if the categories aren’t ordered. There is a possibility you may have to re-code your variable to make it work in data analysis, but we probably want to avoid this. You can actually have a nominal variable as an independent variable and an interval variable as a dependent variable in a regression.
RecapGeneral Rules of Thumb • These are the types of tests you would generally perform for each variable and relationships. These is NOT an exhaustive list. It’s only a general guideline. You should always think about your data and variables before ruling anything out. EVERY SITUATION IS DIFFERENT. • Univariate Statistics: • Always calculate descriptive statistics on your variables. • Always calculate chi-square on your variables. • Bivariate Statistics: (Look at Salkind for how to re-code) • Independent-Dependent Relationship (in data analysis): • Nominal-Nominal:Crosstab, Re-code • Nominal-Ordinal: Crosstab, Phi/Cramer’s V (Gamma) • Nominal-Interval: T-test, Regression Analysis • Ordinal-Nominal: Crosstab,Re-code • Ordinal-Ordinal:Crosstab, Gamma • Ordinal-Interval: T-test, Boxplots • Interval-Nominal:Crosstab, Re-code • Interval-Ordinal: Crosstab, Boxplots, Re-code • Interval-Interval: T-Test, Regression Analysis, Boxplots, Scatterplots