Download
1 / 17
170 likes | 285 Vues
LV Network Templates for a Low Carbon Future. Mark Dale & Gavin Shaddick 26 th October 2012. Outline. Why do we need LV templates? Monitoring & Data: How are we monitoring? The Data Journey Lessons Learnt Statistical Analysis: Overview Clustering m ethodology Classification

E N D
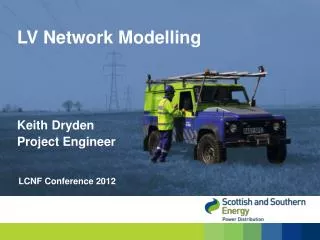
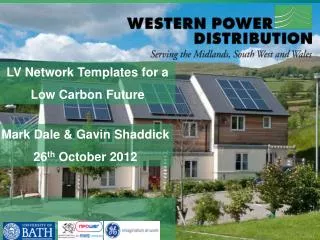
LV Network Templates for a Low Carbon Future Mark Dale & Gavin Shaddick 26th October 2012
Outline • Why do we need LV templates? • Monitoring & Data: • How are we monitoring? • The Data Journey • Lessons Learnt • Statistical Analysis: • Overview • Clustering methodology • Classification • Steps Forward
Why do we need LV Network Templates? • New Challenges • Lack of real data/ understanding of the LV Network • Assets on the network are expensive • Growing consumer market • more connections • Consumer Prosumer adopting more green technology e.g. PV, SHP LV Network Templates
What does the LV Network Templates project deliver to you? Identify the impact of low carbon technologies on the LV Network and enable the creation of LV Templates Identify the possibility of using proxy FIT meters to reflect local area generation output Share findings with all interested parties including other DNO’s
Monitoring & Data
How are we monitoring? Pole Mounted Sub-station Enclosure Street Furniture: Haldo Pillar EDMI Customer Monitoring Ground Mounted 800 Sub-station Monitors 3500 Voltage Monitors 120 PV Monitors
The data journey • Primary data (variable) • Secondary data (fixed) • WAG ARBED • Fixed distribution sub-station data • SSEG generation data
Lessons Learnt • Majority of householders not receptive to installation of voltage monitors • do not understand the role of a DNO • saw WPD’s approaches as sales calls • Multiple routes required for communication to maximise impact and reaction • consider using trusted and known organisations • Make more use of the initial phase-check visit • educate householders about WPD and the meter to be installed • combine with site survey to speed up the installs
Overview • Develop network templates • Use statistical clustering techniques • group sub-stations based on load profiles • Overlay fixed data onto resulting clusters • Create set of classification rules • Using three months of data we have already started to identify clusters which form basis of templates Example of data received over 24 hour period (Wed. 25th July)
Statistical methodology: clustering Based on (dis)similarities in the data Data structured according to - Time (within days, 10 min intervals) - Date (days, months, season) - Sub-stations Real Power Delivered (RPD) Allocates ‘units’ to groups (clusters)
Dendrogram • Black vertical lines indicate how sub-station clusters join together • Highest level split is commercial (left) and residential (right) • Further splits are based on magnitude (RPD) and temporal patterns
Classification Domestic Unrestricted (single rate) Domestic Economy 7 (two rate) Non-Domestic Unrestricted (single rate) Non-Domestic Non-Maximum Demand Economy 7 type (two rate) Non-Domestic Max. Demand Customers with Load Factor 0-20% Non-Domestic Max. Demand Customers with Load Factor 20-30% Non-Domestic Max. Demand Customers with Load Factor 30-40% Non-Domestic Max. Demand Customers with Load Factor >40% • Sub-station clusters contain a mix of customer profile classes
Sub-station profiles over time (within day) • Clusters based on overall levels of RPD (kW) and different temporal patterns
Sub-station profiles over time (weekly) • Clusters exhibit different patterns of RPD (kW)
Steps Forward… • Primary data is being continuously received • Update clustering • Refine classification rules • Create a set of LV templates • Identify stresses on LV networks due to low carbon technologies • WPD and DNOs to discuss LV Network Templates and their applicable use