Inhibition of DNA-PKcs Expression in HepG2, Huh7, and Chang Cells via siRNA Treatment
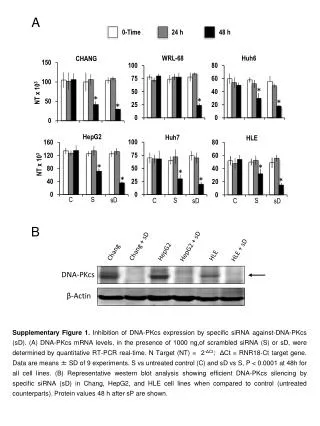
This study investigates the effect of specific siRNA targeting DNA-PKcs on its expression levels in various cell lines, including Chang, HepG2, and HLE. Quantitative RT-PCR results indicate significant downregulation of DNA-PKcs mRNA, with p-values less than 0.0001 compared to untreated controls at the 48-hour mark. Additionally, representative Western blot analyses confirm the effectiveness of the siRNA in silencing DNA-PKcs in all tested cell lines. These findings highlight the potential of siRNA as a therapeutic approach for regulating DNA damage repair pathways in cancer biology.

Inhibition of DNA-PKcs Expression in HepG2, Huh7, and Chang Cells via siRNA Treatment
E N D
Presentation Transcript
A WRL-68 Huh6 CHANG * * * * * HepG2 Huh7 HLE NT x 103 * * * * * * NT x 103 B 0-Time 24 h 48 h Chang + sD HepG2 + sD HLE + sD HepG2 Chang HLE S S S C C C sD sD sD DNA-PKcs β-Actin Supplementary Figure 1. Inhibition of DNA-PKcs expression by specific siRNA against-DNA-PKcs (sD). (A) DNA-PKcs mRNA levels, in the presence of 1000 ng,of scrambled siRNA (S) or sD, were determined by quantitative RT-PCR real-time. N Target (NT) = 2-ΔCt; ΔCt = RNR18-Ct target gene. Data are means ± SD of 9 experiments. S vs untreated control (C) and sD vs S, P < 0.0001 at 48h for all cell lines. (B) Representative western blot analysis showing efficient DNA-PKcs silencing by specific siRNA (sD) in Chang, HepG2, and HLE cell lines when compared to control (untreated counterparts). Protein values 48 h after sP are shown.