Download
1 / 10
100 likes | 298 Vues
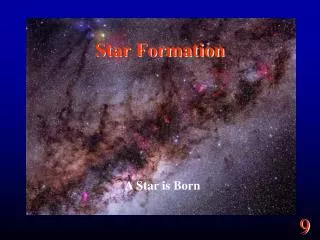
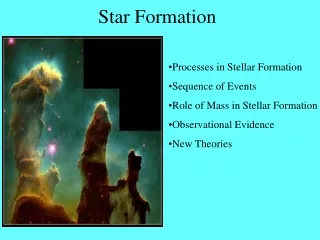
STAR FORMATION AND PLASMA ASTROPHYSICS. Course covers early stages of stellar evolution from star formation though to main sequence . Focus on interrelation between a star’s rotation rate and its magnetic field strength .

E N D
STAR FORMATION AND PLASMA ASTROPHYSICS • Course covers early stages of stellar evolution from star formation though to main sequence. • Focus on interrelation between a star’s rotation rate and its magnetic field strength. • Through its control of a stellar wind the magnetic field governs the rate at which young stars spin down as they evolve towards the main sequence. At the same time the rotation rate governs the magnetic field strength through the action of a dynamo. • This relationship governs many aspects of early stellar evolution.
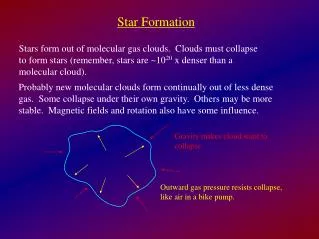
Magnetic fields and plasmas • Magnetic fields inhibit the motion of charged particles which are forced to spiral around field lines. Consequently, charged particles can move along but not across field lines. • This means that magnetic fields can impose structure on a plasma. • They can also insulatea region of plasma (as conduction across field lines is very poor). • Examples: • Solar corona • Fusion devices (e.g. JET)
Transition region Chromosphere Corona Photosphere T = 5780 K 500, 000K 1 - 2 x 10⁶ K 4200K 1015 m-3 1010 m-3 Density = 1022 m-3 500 km 2000 km (cf: density of air at sea level ~ 1025 particles m-3 Signatures of stellar magnetic fields: global • Presence of an X-ray corona e.g. the Sun
At coronal temperatures (e.g. 107 K) the thermal speed of a hydrogen atom is greater than the escape speed. • Hence the presence of an X-ray corona implies that the emitting plasma is confined. • Structure of solar corona supports this • helmet streamers • loops • coronal holes: solar wind escapes along open field lines
Stellar X-ray flux varies with rotation rate - note initial increase in luminosity with increasing rotation rate, then saturation - often attributed to saturation of the stellar dynamo responsible for generating magnetic flux A ROSAT survey of the Pleiades shows X-ray luminosity varying with rotation speed (v sini). (see Stauffer et al, 1994, Ap. J. Suppl., 91, pp 625-657)
Chromospheric emission (e.g. Ca II H&K, Mg II, Si II) also indicates the presence of a magnetic field and shows a similar variation with rotation rate. • large range in flux density • lower limit to flux density (the basal flux) which decreases sharply with increasing (B-V) (see handout) • Once the basal flux is subtracted out, there is a good correlation between chromospheric and coronal activity indicators. • Both appear to be governed by the same process, believed to be the stellar magnetic field. The basal flux may be due to acoustic heating, • Summary: global indicators show magnetic activity varies greatly across the HR diagram.
Signatures of stellar magnetic fields: local Sunspots: • Magnetic field strengths ~ 1kG (1G = 10-4 T) • Dark central umbra ~ 1500K cooler than surroundings as the intense magnetic fields inhibit convection • Numbers show (approx) 11yr cycle but note • cycle length varies from 7-17 yr • long term trends e.g. Maunder Minimum from 1645: 70 years of no spots • net polar flux varies over 22 yrs • Latitude range 40o to 5o • spot latitudes drift towards the equator over each cycle (the butterfly diagram)
Ca II H&K flux time • Starspots: • seen as rotational modulation of stellar lightcurve. • Mt. Wilson Ca II H&K photometric survey showed: - that many stars have activity periods similar to the Sun - but some have apparently random variations or no variation at all.
Magnetic field strengths measured by Zeeman splitting of lines (B 2) to be 1-10 kG but • broadening of lines due to rapid rotation may mask the splitting • only high field strengths can be measured • more accurate for longer wavelengths • may give misleading results if polarities are mixed within a resolution element and so they effectively cancel out • Doppler imaging of rapidly-rotating stars suggests that spots may appear at much higher latitudesthan on the Sun and also in more than one band.