Lecture Outline
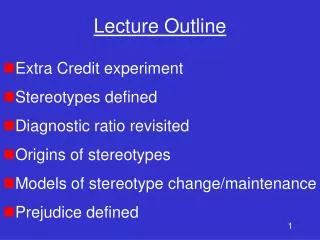
Lecture Outline. Extra Credit experiment Stereotypes defined Diagnostic ratio revisited Origins of stereotypes Models of stereotype change/maintenance Prejudice defined. Ashmore & Del Boca (1981) A stereotypes is…... “A set of beliefs about the personal attributes of a group of people”.

Lecture Outline
E N D
Presentation Transcript
Lecture Outline • Extra Credit experiment • Stereotypes defined • Diagnostic ratio revisited • Origins of stereotypes • Models of stereotype change/maintenance • Prejudice defined
Ashmore & Del Boca (1981) A stereotypes is…... “A set of beliefs about the personal attributes of a group of people”
Ashmore & Del Boca (1981) Limitation: Many attributes are perceived as typical of a group and yet are not part of people’s stereotypes
Stereotypes include attributes that are perceived as: TYPICAL and DISTINGUISH BETWEEN GROUPS
Diagnostic Ratio DR = % of group (with attribute) % of reference (with attribute)
Diagnostic Ratio When DR = 1 (or close to 1), attribute does not distinguish between groups • attribute not part of stereotype
Diagnostic Ratio When DR substantially > than 1 • attribute distinguishes between groups • attribute is stereotypic of group
Diagnostic Ratio When DR substantially < than 1 • attribute distinguishes between groups • attribute is counterstereotypic of group
McCauley & Stitt (1978) Purpose: 1. Show utility of DR 2. Measure (in)accuracy of stereotype about African Americans
McCauley & Stitt (1978) • Sampled five groups • Created DR’s based on perceptions of African Americans and Americans • Created criterion DR’s based on census information
Results: McCauley & Stitt (1978) Attribute Criteria HS College Union Choir SW HS .65(.68) (.73) (.67) (.68) (.60) Illegitimate 3.10(1.80) (1.70) (2.10) (1.90) (2.30) Unemployed 1.90 (1.90) (1.60) (1.80) (2.60) (2.30) Victims 1.50 .83 (1.80) (2.00) 1.50 2.30 Welfare 4.60 (2.30) (1.90) (1.60) (1.80)1.40 Kids 1.90 (1.60) (1.40)1.60(1.30) (1.30) Female head 2.80 (1.70) (1.90) (1.70) (1.50) (1.70) (Green) DR’s: different from 1 (p < .05); n = 30 Black DR’s not different from 1 (p > .05); n = 5 Underlined DR’s = different from criteria (p < .05); n = 16 76
Results: McCauley & Stitt (1978) Attribute Criteria HS College Union Choir SW HS .65(.68) (.73) (.67) (.68) (.60) Illegitimate 3.10(1.80) (1.70) (2.10) (1.90) (2.30) Unemployed 1.90 (1.90) (1.60) (1.80) (2.60) (2.30) Victims 1.50 .83 (1.80) (2.00) 1.50 2.30 Welfare 4.60 (2.30) (1.90) (1.60) (1.80)1.40 Kids 1.90 (1.60) (1.40)1.60(1.30) (1.30) Female head 2.80 (1.70) (1.90) (1.70) (1.50) (1.70) Most DR’s different from one (green): People held stereotype of African Americans 77
Results: McCauley & Stitt (1978) Attribute Criteria HS College Union Choir SW HS .65(.68) (.73) (.67) (.68) (.60) Illegitimate 3.10(1.80) (1.70) (2.10) (1.90) (2.30) Unemployed 1.90 (1.90) (1.60) (1.80) (2.60) (2.30) Victims 1.50 .83 (1.80) (2.00) 1.50 2.30 Welfare 4.60 (2.30) (1.90) (1.60) (1.80)1.40 Kids 1.90 (1.60) (1.40)1.60(1.30) (1.30) Female head 2.80 (1.70) (1.90) (1.70) (1.50) (1.70) Some DR’s different from criteria [underlined]. Other DR’s not different from criteria [not underlined]: People’s stereotypes were both inaccurate [underlined] and accurate [not underlined] 78
Results: McCauley & Stitt (1978) Attribute Criteria HS College Union Choir SW HS .65(.68) (.73) (.67) (.68) (.60) Illegitimate 3.10(1.80) (1.70) (2.10) (1.90) (2.30) Unemployed 1.90 (1.90) (1.60) (1.80) (2.60) (2.30) Victims 1.50 .83 (1.80) (2.00) 1.50 2.30 Welfare 4.60 (2.30) (1.90) (1.60) (1.80)1.40 Kids 1.90 (1.60) (1.40)1.60(1.30) (1.30) Female head 2.80 (1.70) (1.90) (1.70) (1.50) (1.70) When DR’s indicated inaccurate stereotype [underlined], difference was smaller than criteria: People’s stereotypes underestimated real differences. They did not exaggerate real differences 79
McCauley & Stitt (1978): Summary • People endorsed a stereotype of AA • most DR’s different than 1 • AA stereotype was accurate & inaccurate • some DR’s different from criteria (inaccurate) • other DR’s not different from criteria (accurate) • AA stereotype underestimated real difference • when DR different from criteria, it was smaller
Origin of Stereotypes:Where do they come from? • Socio-cultural perspective • Kernel of Truth hypothesis • Illusory correlations
Socio-Cultural Perspective • Premise: Individuals are socialized into a particular culture (e.g., media or significant others)
Socio-Cultural Perspective 1. People are born into a culture 2. People are rewarded/punished for their beliefs, values, behaviors 3. People act in accord with norms 4. People internalize norms 5. Internalization perpetuates the norms
Socio-Cultural Perspective Two versions of socio-cultural view • Structuralist-Functionalist • Conflict theory
Structuralist-Functionalist Version • A single culture accepted throughout a society i.e., individuals in a society are similar in their beliefs, values and behaviors
Structuralist-Functionalist Version Function of stereotypes: • stereotypes communicate expected behavior • stereotypes communicate how different people should be treated
Structuralist-Functionalist Version More evident in more homogeneous and collectivist societies
Conflict Theory Version • Multiple subcultures within society • People accept norms of their subculture
Conflict Theory Version • People within a subculture are similar in their beliefs, values, behaviors • People in different subcultures are different in their beliefs, values, behaviors • The more different two subcultures, the greater the conflict in their beliefs, values, behaviors
Conflict Theory Version Function of stereotypes: • stereotypes justify prejudice • incompetence justifies lower pay • laziness justifies poverty
Conflict Theory Version More evident in more heterogeneous societies
Kernel of Truth Hypothesis • Premise: Stereotypes are exaggerations that exist in some measure in a group
Kernel of Truth Hypothesis 1. The larger a real difference between groups, the more likely the attribute will be in the stereotype • Example: Circumscribing and non-circumscribing tribes
Kernel of Truth Hypothesis 2. Stereotypes become more accurate as contact between groups increases • Example: women/men v.s. African Americans/Whites
Kernel of Truth Hypothesis 3. Behaviors punished in one group, but not in another, tend to be in a stereotype • Example: nudity and bathroom practices
Kernel of Truth Hypothesis 4. Similar behaviors that groups perform in different situations tend to be in stereotypes, but connote different valences. Example……...
We are loyal. We are brave and progressive. We are thrifty. They are clannish. They are aggressive and expansionistic. They are cheap. Kernel of Truth Hypothesis
Kernel of Truth Cautionary Statements • Perceived differences are not veridical • Perceived differences are exaggerated • Perceived differences reflect social factors, not genetic differences
Illusory Correlations • Definition: People overestimate how strongly two things are related (e.g., arthritis pain and changes in the weather)
Illusory correlations & stereotype formation • People associate a group with an attribute (African Americans & crime) • Cognitive biases “corroborate” the perceived association • confirmation biases in hypothesis testing • remember consistent information better
Illusory Correlation • People most susceptible to illusory correlations when: • group is relatively small • attribute is rare in population
Illusory CorrelationExample • African Americans are a minority in the US. Whites are the majority • Being a media superstar is rare • Illusory correlation likely…… • More AA (small group) superstars (rare event) than White (large group) superstars (rare event)
Illusory Correlation Negative behavior more rare than positive behavior Implication: • Negative behavior by minority more memorable and salient than same behavior by majority • Negative behavior becomes part of stereotype of minority
Stereotype Change Consensual stereotypes change over time, across individuals. Very little known about stereotype change over time, within individuals (see Weber & Crocker, 1983, for an exception)
Models of Stereotype Change • Bookkeeping Model • Conversion Model • Subtyping Model Focus on stereotype-inconsistent information
Bookkeeping Model • Stereotype change is incremental • Each instance of inconsistent information modifies the stereotype • Single instance = small change • Accumulation = large change
Bookkeeping Model • Implication: Stereotype change will be similar regardless of whether inconsistent information is concentrated or dispersed. Amount (not dispersion) matters.
Conversion Model • Stereotype change is dramatic • Stereotypes change in response to large and salient inconsistent info. • Stereotypes remain unchanged by minor inconsistent information
Conversion Model • Implication: Stereotype change will be greater when inconsistent information is concentrated v.s. dispersed
Subtyping Model • Stereotypes hierarchically structured • Rare, inconsistent instances lead to creation of subtypes. • Instances regarded as “exceptions” • Stereotype protected from change • Common, inconsistent instances result in stereotype change
Subtyping Model • Implication: Stereotype change will be greater when inconsistent information is dispersed v.s. concentrated
Weber & Crocker (1983) Purpose: • Tested the three models of stereotype change
Weber & Crocker (1983) Procedure: • Given information about corporate lawyers • Rated each lawyer on stereotypic traits
Weber & Crocker (1983) Manipulations: • Dispersion of Inconsistent info: • Dispersed across all members • Concentrated in 1/3 of members • Group size: • 6 members v.s. 30 members • Amount of inconsistent info higher in larger group
Weber & Crocker (1983) Predictions Dispersion has no effect on stereotype change, but amount does (bookkeeping) Stereotype change greater when inconsistent info concentrated (conversion) Stereotype change greater when when inconsistent info dispersed (subtyping)