Earthquake Hazard Assessment: Alternative Mmax Models
Explore diverse methods in seismicity source modeling for earthquake hazard assessment. Compare hazard results with current USGS model using alternative Mmax models. Analyze ground motion probabilities for selected sites.

Earthquake Hazard Assessment: Alternative Mmax Models
E N D
Presentation Transcript
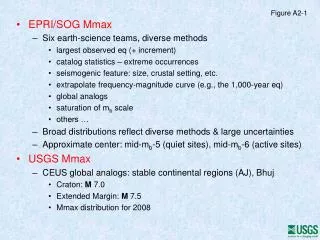
Figure A2-1 • EPRI/SOG Mmax • Six earth-science teams, diverse methods • largest observed eq (+ increment) • catalog statistics – extreme occurrences • seismogenic feature: size, crustal setting, etc. • extrapolate frequency-magnitude curve (e.g., the 1,000-year eq) • global analogs • saturation of mb scale • others … • Broad distributions reflect diverse methods & large uncertainties • Approximate center: mid-mb-5 (quiet sites), mid-mb-6 (active sites) • USGS Mmax • CEUS global analogs: stable continental regions (AJ), Bhuj • Craton: M 7.0 • Extended Margin: M 7.5 • Mmax distribution for 2008
USGS (margin) EPRI/SOG 4.5 5.0 5.5 6.0 6.5 7.0 7.5 Figure A2-3 Mmax (mb) EPRI/SOG and USGS Mmax distributions for South Texas Project site’s host source zones (original EPRI/SOG, not updated for 2006 Gulf of Mexico earthquakes)
USGS (margin) EPRI/SOG 4.5 5.0 5.5 6.0 6.5 7.0 7.5 Figure A2-4 Mmax (mb) EPRI/SOG and USGS Mmax distributions for North Anna site’s host source zones
Figure A2-5 Analysis • Develop alternative Mmax models that span those used in EPRI/SOG (and current PSHA practice) • Test Mmax models using USGS hazard model and computer codes • seismicity-based sources only (because they control the mid- to high-frequency hazard at many sites & Mmax is uncertain and controversial) • hold all parameters fixed except Mmax • Compare hazard results with current USGS model as ratio hazard maps and lists for selected sites • numerator: alternative Mmax / denominator: standard USGS Mmax • probabilistic ground motions for PGA, 5 Hz, 1 Hz • 2% probability of exceedance in 50 years
Figure A2-6 Alternative Mmax Models • M5.0c5.5m • M 5.0 in craton, M 5.5 in margin • mb equivalent: 5.47c, 5.90m (AB95) or 5.27c, 5.67m (J96) • M6.0c6.5m • M 6.0 craton, M 6.5 margin • mb equivalent: 6.29c, 6.66m (AB95) or 6.04c, 6.40m (J96) • M7.0c7.5m • M 7.0 craton, M 7.5 margin • mb equivalent: 7.00c, 7.32m (AB95) or 6.74c, 7.07m (J96)
North Anna M5.0c5.5m M5.0c5.5m M6.0c6.5m M6.0c6.5m M7.0c7.5m M7.0c7.5m mmax (mb) SouthTexas mmax (mb) Figure A2-7 4.5 5.0 5.5 6.0 6.5 7.0 7.5 Mmax (mb) 4.5 5.0 5.5 6.0 6.5 7.0 7.5 Mmax (mb)
Figure A2-8 Hazard map (PGA, 2% prob of exc in 50 yrs): seismicity sources only, standard USGS Mmax (Prob of exc, px: probability of exceedance) Ratio hazard map (PGA, 2% prob of exc in 50 yrs): seismicity sources only / all sources Warm colors show where seismicity-based sources control hazard.
0.2-sec SA 1.0-sec SA Figure A2-9 Alternate Mmax model: M5.0c5.5m Ratio hazard maps (2% prob of exc in 50 yrs) M5.0c5.5m (sso) / standard USGS Mmax model (sso) (Prob of exc, px: probability of exceedance)
0.2-sec SA 1.0-sec SA Figure A2-10 Alternate Mmax model: M6.0c6.5m Ratio hazard maps (2% prob of exc in 50 yrs) M6.0c6.5m (sso) / standard USGS Mmax model (sso) (Prob of exc, px: probability of exceedance)
0.2-sec SA 1.0-sec SA Figure A2-11 Alternate Mmax model: M7.0c7.5m Ratio hazard maps (2% prob of exc in 50 yrs) M7.0c7.5m (sso) / standard USGS Mmax model (sso) (Prob of exc, px: probability of exceedance)
Figure A2-12 Ratios of probabilistic ground motions (2% probability of exceedance in 50 yrs): Alternate Mmax (seismicity sources only) / USGS (seismicity sources only)
0.2-sec SA 1.0-sec SA Figure A2-13 Alternate Mmax model: M5.0c5.5m Ratio hazard maps (2% prob of exc in 50 yrs) Use M5.0c5.5m for numerator seismicity sources, but add the faults to both the numerator and denominator models (Prob of exc, px: probability of exceedance)