Download
1 / 38
380 likes | 407 Vues
Explore how genetic equilibrium influences evolution through allele frequencies in populations. Learn how mutations, environmental factors, and genetic recombination contribute to variations. Discover the Hardy-Weinberg model's predictive power in genetics.

E N D
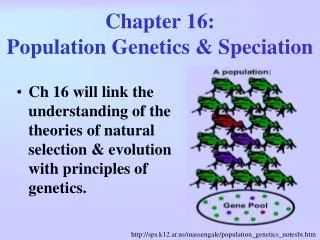
Chapter 16: “Population Genetics and Speciation” Aka: Natural Selection meets Genetics - What Darwin Never Knew
16.1: Genetic Equilibrium Amongst any population, there are always variations
Bell Curve • Graph showing frequencies of occurrences with the majority in the middle and curving out towards the extremes. • Gene frequencies within a population follow this curve.
Population Genetics Study of how genetics plays a role in evolution **New definition of evolution: • Agradual change in the genetic material within a population over time. **Old definition of evolution • Development of new types of organisms from pre-existing types of organisms over time
So what causes these variations in populations? • Variations – caused by: • Environmental factors (food availability, amount of sunlight, etc.) • Mutations – gene and chromosomal • Recombinations (crossing over, independent assortment) • Random fusion of gametes - each brings their own set of genes
Gene Pool Peccaries are small, tough relatives of the modern pig, whose lineage diverged about 40 million years ago. They live in southern Texas, Arizona, and New Mexico. A gene pool is the sum of all the individual genes (alleles) in a given population. A population is the smallest unit of living organisms that can undergo evolution.
Determining Allele Frequency If we could take inventory of the gene pool and find out all of the alleles present, then we could apply a simple mathematical formula to make predictions about how the gene pool might change over time – you will see WHY we do this in the next section!!!
Suppose… • A certain population has two alleles, B and b in 10 gametes. • Let’s say 3 of the gametes carry the B allele, and 7 carry the b allele – what is the allele frequency of B and b? • Answer: 0.3 or 30% and 0.7 or 70%. • So, how do we determine allele frequency?
Applications of Allele Frequency If two parents are each pure breeding for a certain characteristic: RR x rr Then their offspring will have these genotypes: 4Rr Out of 8 total alleles: R = 4/8 = 0.5 = 50% r = 4/8 = 0.5 = 50% Notice that 0.5 + 0.5 = 1; must be that way because you are dealing with frequencies
Applications of Allele Frequency, cont. If two parents are hybrids for a certain characteristic: Rr x Rr Then their offspring will have these genotypes: RR 2Rr rr Out of 8 total alleles: R = 4/8 = 0.5 = 50% r = 4/8 = 0.5 = 50% Notice that 0.5 + 0.5 = 1; must be that way because you are dealing with frequencies
So what, big deal, who cares? • Did the phenotype frequencies change from the P to the F1 generation? • Did the genotype frequencies change from the P to the F1 generation? • So, did evolution actually occur, and will it occur with this same population given the same circumstances? • From here, we proudly introduce…
Hardy and Weinberg * A mathematician and a physician who in 1908 developed a mathematical model to predict gene frequencies in future populations in an attempt to explain microevolution (change in genetic material of a population). Macroevolution (chapter 15) is change on a phenotypic level. • This is ONE equation they used: p + q = 1 where p = dominant allele where q = recessive allele p equals all of the alleles in individuals who are homozygous dominant (AA) and half of the alleles in people who are heterozygous (Aa) for this trait in a population. So, if 30% of a population had a certain trait, you could calculate what % must have the other (70%). You would not know, however, what % was heterozygous right-handed with this equation.
Applications, cont. • We will use the 4 o’clock flower as an example • Remember – this flower has an incomplete dominance inheritance pattern
In a population, there are 4 red four o’clock flowers and 4 pink ones (incomplete dominance) RR RR RR RR RrRrRrRr • Phenotype frequency = 4/8 Red 4/8 Pink 0.5 0.5 or 50% 50% Allele frequency = R 12/16 r 4/16 0.75 0.25 HW call R = p and r = q and state: p + q = 1
Second generation: 5 Red, 2 pink and 1 white RR RR RR RR RR Rr Rr rr Phenotype frequency = 5/8 Red 2/8 Pink 1/8 White .625 .25 .125 Allele frequency = R 12/16 r 4/16 .75 .25 .75 + .25 =1 **So the allele frequencies remain the same from generation to generation in a closed population because you are dipping into the same gene pool!
So what is the likelihood of two “R” genes (RR) being pulled from the gene pool? • If p = .75 • then it’s p2 = .75 x .75 = .5625 – WHY? • p2 = homozygous dominant allele frequency • If q = .25 • - then it’s q2 = .25 x .25 = .0625 – WHY? • q2 = homozygous recessive allele frequency • WAIT – why don’t these two values add up to 1? WHAT is missing and how do we find it?
How about them hybrids? • Frequencies of all types must add up to 1.0 p + q = 1 • So, 1.0 – frequency of RR – frequency of rr = frequency of Rr • 1.0 - .5625 - .0625 = 0.375 (frequency of Rr)
Hardy Weinberg Genetic Equilibrium equation p is defined as the frequency of the dominant allele and q as the frequency of the recessive allele for a trait controlled by a pair of alleles (A and a). In other words, p equals all of the alleles in individuals who are homozygous dominant (AA) and half of the alleles in people who are heterozygous (Aa) for this trait in a population. p + q = 1 (p + q) x (p + q) = 1 p2 + 2pq + q2 = 1 Hybrid frequency Pure Dominant frequency Pure Recessive frequency
Let’s Practice! • p2 + 2pq + q2 = 1 and p + q = 1 • p = frequency of the dominant allele in the population • q = frequency of the recessive allele in the population • p2 = percentage of homozygous dominant individuals • q2 = percentage of homozygous recessive individuals • 2pq = percentage of heterozygous individuals
Practice, cont. • SHOW ALL WORK ON A SEPARATE PIECE OF LOOSE LEAF PAPER • You have sampled a population in which you know that the percentage of the homozygous recessive genotype (aa) is 36%. Using that 36%, calculate the following: • - The frequency of the "aa" genotype. • The frequency of the "a" allele. • The frequency of the "A" allele. • The frequencies of the genotypes "AA" and "Aa." • The frequencies of the two possible phenotypes if "A" is completely dominant over "a."
Practice, cont. • Brown hair (B) is dominant to blond hair (b). If there are 168 brown haired individuals in a population of 200, calculate all phenotypic and allele frequencies. 2. If 81% of a population is homozygous recessive for a given trait.......... • What is the predicted frequency of homozygous dominant? • What is the predicted frequency of heterozygotes?
Hardy Weinberg Genetic Equilibrium Hardy and Weinberg showed that allele frequencies inapopulation remain the same over timeunless acted upon by outside influences
Assumptions The allele frequencies of generations within a population will remain the same if: • large population - to insure no sampling error from one generation to the next • random mating - no assortative mating or mating by phenotype • no mutations – allele frequencies don’t show a net change due to mutations • no migration between populations • no natural selection – all genotypes reproduce with equal success
Disruption of Genetic Equilibrium (results in evolution!) 1. Mutations – occur spontaneously Introduce new alleles into population • Harmful mutations are slowly selected out while beneficial mutations drive evolution
2.Migration • Constant movement of animals within a population, both in and out • Immigration – movement into a population • Emigration – movement out of a population These conditions are referred to as gene flow – movement of genes from one population to another
3.Genetic Drift • Random events or chance • Small populations • Disease • Natural disasters
Genetic Drift occurs when a small population is isolated. • Dipping in to the same gene pool. • Gene frequency changes but not due to natural selection or adaptive advantage. Due to purely chance. • Danger occurs when only 1 allele is left. No variation w/in a population • Simulation
4.Nonrandom Mating • What if mating only occurs with people within one’s own village? • Dipping into the same gene pool could expose disorders due to the repetitive appearance of recessive genes • Assortative mating – organisms tend to mate with others that are similar to them • Sexual selection - attractive phenotypes such as brightly colored feathers (peacock); human pheromones
5.Natural Selection • Most significant factor to disrupt genetic equilibrium • Peppered moths in Industrial England – White trees became soot covered White on white – > in numbers White on dark - < in numbers Sooty on light - < in #’s
Stabilizing Directional Disruptive
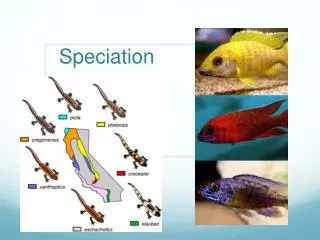
16.3 Formation of a Species – Speciation • Species – • a population of organisms that can successfully interbreed and can produce a viable, fertile offspring with others out of their species • Morphologically (internal & external structures) they are all similar; can be confusing because of phenotypic variations
What drives speciation? • Isolation – separates breeding populations • 1) Geographic isolation – physical separation from original habitat = allopatric speciation Development of a deep cannon, river changes, land floats, volcanic activity, etc • Isolation stops gene flow between two subpopulations • Populations diverge and can no longer interbreed
What drives speciation? 2) Reproductive Isolation- caused by barriers to successful breeding between population groups in the same area such as disruptive selection – two types: Prezygotic isolation – occurs before fertilization * Incompatible behaviors - different mating seasons and mating calls * Sympatric speciation – within the same area
Prezygotic isolation Leopard Frog Wood Frog Wood frogs mate in late March, Leopard frogs mate in mid April; since both are of the genus Rana, they can interbreed but do not
What drives speciation? • Post zygotic isolation • occurs after fertilization • due to a failure of zygote to develop or infertility • wastes gametes
Rates of Speciation • Gradualism – evolution is a constant process and occurs at a steady rate • Punctuated equilibrium- Periods of stability separated by accelerated changes • Species arise abruptly then have long periods of little change
Chapter Closure • How might the following scientists have responded if they knew about the modern day approaches to evolution as described in this chapter? Why? • Cuvier • Lyell • Lamarck • Mendel • Darwin