Download
1 / 116
1.16k likes | 1.3k Vues
Comparative Regional Economy <Lecture Note 5R > 12.05.14. CRE : CIS, Sub-Saharan Africa and Latin America * Some parts of this note are summary of the references for teaching purpose only. Semester: Spring 2012 Time: Monday 2:00-5:00 pm Class Room: 115

E N D
Comparative Regional Economy <Lecture Note 5R > 12.05.14 CRE: CIS, Sub-Saharan Africa and Latin America * Some parts of this note are summary of the references for teaching purpose only. Semester: Spring 2012 Time: Monday 2:00-5:00 pm Class Room: 115 Professor: YooSoo Hong Office Hour: By appointment Mobile: 010-4001-8060 E-mail: yshong123@gmail.com 1
CIS (Commonwealth of Independent States) • History - The organization was founded on December 1991 by the Republic of Belarus, the Russian Federation, and Ukraine on the dissolution of the Soviet Union and the creation of CIS as a successor entity to the USSR. - There are 10 member states of the Commonwealth of Independent States and one Ukraine observation. • Areas of member-states’ joint activities: - Protecting people’s rights and freedoms - Coordination foreign policy - Cooperation in the formation of a common economic space, developing transport and communication systems - Healthcare and environmental protection - Social issues and immigration policies - Fighting organized crime - Cooperation in defense polices and guarding borders
Regional Organizations Related to CIS • Although the CIS has few supranational powers, it is aimed at being more than a purely symbolic organization, nominally possessing coordinating powers in the realm of trade, finance, lawmaking, and security. It has also promoted cooperation on and cross-border crime prevention. • Some of the members of the CIS have established the Eurasian Economic Community with the aim of creating a full-fledged common market. • Associated organizations • Free trade area (CISFTA) - In 1994, the CIS countries agreed to create a free trade area, but the agreements were never signed, so in 2009 a new agreement was achieved to create an FTA by the beginning of 2011.
Eurasian Economic Community • The Eurasian Economic Community originated from a customs union between Belarus, Russia and Kazakhstan on the 29 March 1996.[24] It was named the EAEC on 10 October 2000[25] when Belarus, Kazakhstan, Kyrgyzstan, Russia, and Tajikistan signed the treaty. EurAsEC was formally created when the treaty was finally ratified by all five member states in May 2001. Armenia, Moldova and Ukraine hold observer status. EurAsEC is working on establishing a common energy market and exploring the more efficient use of water in Central Asia. • Organization of Central Asian Cooperation - Kazakhstan, Kyrgyzstan, Tajikistan, Turkmenistan and Uzbekistan formed the OCAC in 1991 as Central Asian Commonwealth (CAC). - In 1998 it became the Central Asian Economic Cooperation (CAEC), in February 2002 it was renamed to its current name. • Common Economic Space: formed in 2003, aiming at monetary union - A Customs Union of Belarus, Kazakhstan and Russia was thus created in 2010 with a single market envisioned for 2012.
CEE and CIS Entering Crisis CEE and CIS also entered the crisis - With macroeconomic and financial indicators showing more vulnerabilities relative to other emerging regions (dependence on external financing, remittances, commodities, higher private sector debt) GDP growth (annual percent change) CEE - Central and Eastern Europe; CIS - Commonwealth of Independent States
Growth Forecasts in CIS % Source: IMF
Russia: Physical Map Kamchata Peninsula Russian Plain Ural Mts Kazay uplands
Introduction Russian Domain includes Russia, Belarus, Ukraine, Georgia, and Armenia (all were part of the U.S.S.R.) Russia is the largest country (in land area) on Earth; it spans 11 time zones • Rich in resources, but has one of the harshest climates The Russian Domain has had extremely rapid political and economic change since 1990 • From centrally planned economy to capitalism • From authoritarian dictatorship to democracy • Region’s economy is weak; commitment to democracy uncertain, nationalist movements threaten stability • Ukraine, Belarus, Georgia, Armenia must build global relationships
Russia U.S.S.R. Russia Population: 289 million Population: 144 million Area: 22.4 million km2 Area: 17 million km2
Russia: Land Frontiers • Russia shares boundaries with twelve countries: - Ukraine, Belarus, Latvia, Estonia, Finland, Norway, Mongolia, North Korea, China, Kazakhstan, Azerbaijan and Georgia. • A boundary that measures 12,880 km (8000 mi.) stretches between the Black Sea and the Pacific ocean. • In the Far East, Sakhalin Island is separated from the northernmost main island of Japan by a 40 km. (25 mi.) strait; even narrower straits separate Japan from the Russian held Kuril Islands
Russia: Population Russian population is declining; from 147,300,000 in 1997, down to 145,500,000 in 2002. • Russia rank 8th in population among the countries of the world. • Russia has 2.30% of the world’s population. • A little more than a century ago, Russia had twice as many inhabitants as the U.S.; now Russia has about one-half the U.S. population.
Russia: Resources • Russia has a rich resource base. • One of the most important mineral producing countries with widely scattered deposits. • Russia leads the world in the production of natural gas and lead. • Russia also leads the world in iron ore reserves and natural gas reserves. • Russia is second in the production of platinum, tungsten, aluminum and vanadium.
Russia: Regions The Ural Mountains: • Iron, ferro alloys, copper, aluminum, potash, asbestos, magnesium, low-grade coal The Volga-Urals and West Siberian Plain: • Petroleum and natural gas The Caucasus-Caspian Region: • Petroleum, natural gas, nonferrous metals Middle Asia: • Coal, copper, iron, natural gas, oil, sulfur, lead, zinc, aluminum, uranium, ferro alloys, phosphate, asbestos, mercury, sodium sulfate. More than 90% of Russia’s coal reserves are found in Asiatic CIS.
Russia: History Highlights • 1462: Establishment of the Grand Duchy of Muscovy. • Period of eastward expansion by the Cossacks. • 1682-1725: Czar Peter the Great • 1760-1796: Czarina Catherine the Great • Period of colonialism, imperialism. Major expansions in quest of warm water ports. • 1917: Russian Revolution, establishment of Communist government, formation of the USSR. • 1979: USSR invasion of Afghanistan, again in quest of a warm water port. • 1991: Collapse of the USSR, political reorganization, formation of the Commonwealth of Independent States.
Russia: Political Geography - In 1991, the Union of Soviet Socialist Republics (USSR) was succeeded by the Commonwealth of Independent States (CIS), which included all the former Soviet republics except Lithuania, Latvia, Estonia, and Georgia; these proclaimed their independence. • Following the devolution of the Soviet Union, the map of the Russian Federation comprises 22 federal republics and two federal cities, Moscow and St Petersburg - Based on relative location, Russia’s internal republics are classified into five groups: • The Republics of the Heartland: Mordoviya, Chuvashiya, Mariy-el, Tatarstan, Udmirtiya, Bashkortostan, and the Urals Republic • The Republics of the Caucasian Periphery: Dagestan, Chechnya, Ingushetiya, North Ossetia, Kabardino-Balkariya, Karachayevo-Cherkisiya, Adygeya, and Kalmykiya
The Republics of the Southeast: Altaya, Khakasiya, Buryatiya, Tyva, PromorskiyKray (Maritime Republic) • The Republics of the North: Kareliya, Komi, Sakha (Yakutiya) • Yevreskaya(Jewish) Autonomous Region • Following the election of Vladimir Putin as President in March 2000, one of his first moves was to turn Russia into “a single economic and legal space.” He issued a presidential decree which divided Russia’s 89 republics and regions into seven new “federal districts.”: • Central (Moscow), Far Eastern (Khabarovsk), North Caucasus (Rostov-na-Donu), Northwest (St. Petersburg), Siberia (Novosibirsk), Urals (Yekaterinburg), and Volga (Nizhny Novgorod).
The Fall of the USSR • December 1991 - CPSU formally dismantled - Commonwealth of Independent States (CIS): Loosely organized - Gorbachev resigns as President of USSR. - Soviet Union ceases to exist. • 1991-1999 - Boris Yeltsin dissolved parliament in 1993: New parliament, New constitution. - Formed Commonwealth of Independent States of CIS - Shock Therapy for Economy - 11 of 15 former Soviet Republics join CIS
1999-2008 • Vladimir Putin appointed President in 1999 (won re-election twice) • Forcefully dealt with Chechnya • Tightened Grip of government on Economy • Restricted Voting Rights and Liberties
Economic Status of Armenia, the Kyrgyz, Tajikistan, Russia and the CIS
Importance of Remittances to Low Income CIS Economies (2008)
Economic Crisis and Low Income CIS - All three countries suffered an external shock. - Remittances fell by nearly a third in dollar terms in 2009, from 2008 levels, in all three countries, because of recession in Russian construction industry and depreciation of the Russian rouble. - Exports fell by 32 percent in Armenia and 16 percent in Kyrgyz Republic. - Armenia suffered a large fall in FDI. - Unlike middle income CIS, these economies did not suffer a reversal of private capital inflows, because they had attracted very little short term capital prior to the crisis. - Adjustment to the external shock was via compression of imports, which fell by 24-27 percent in dollar terms in 2009.
External Shock and Real Output - Armenia was hit very hard, with real GDP falling 14 percent in 2009. - KY and Tajikistan suffered a slowdown but avoided recession. - Private investment fell sharply in Armenia and Tajikistan: in Armenia this was a large component of aggregate demand prior to the crisis, which is one of the main reasons why the recession was so severe. - Private consumption fell in all three countries, because the fall in remittances cut household incomes. - Real exchange rate depreciation dampened the impact of lower remittances on household incomes and shifted much of the burden of adjustment to lower private consumer demand to imported consumer goods, thereby avoiding severe falls in demand for non traded goods; this is partly why KY and Tajikistan avoided recession.
Private Investment and FDI in Armenia, Kyrgyz Republic and Tajikistan: 2007-2009
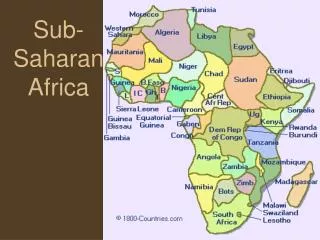
Vegitation More grassland than tropical rainforest. Tropical rainforest (Selva) is different from jungle. There is very little jungle.
Major Religions • Diffusion • Source areas • Colonization • Missionaries • Rapid growth of Islam
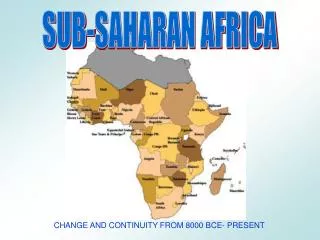
Historical Tragedy of Africa • Slave Trade • Estimated 12 million were taken from Africa and sent to the Western Hemisphere from 1500-1870. • Enslaved Africans sent to Europe, North Africa, Southwest Asia
Legacies of Colonialism and Conflict • European Colonization • Before the arrival of Europeans, Sub-Saharan Africa had a complex pattern of kingdoms, states, and tribal societies. • It took Europeans centuries to gain control of this region. • The Disease Factor • Malaria and other tropical diseases made it difficult for Europeans to establish colonies. • Quinine made colonization possible. • The wealth of the region made colonization desirable. • The Scramble for Africa • Berlin Conference of 1884: 13 European countriesdivided and traded Sub-Saharan Africa; no African nations • Ethiopia remained unconquered
Development Performance in SSA • 1950s & 1960s • Africa: large endowments of natural resources expected to encounter higher rates of economic growth in post-independence period. • After Independence • SSA: the most heavily indebted countries • Debt Crisis (late 1970s ~ beginning of the 1970s) –cease lending to SSA • Industrialized Western countries : protectionist trade policies +recessions in their own economy • Declining living standards + rising OECD trade barriers • Annual GDP Growth Rate • SSA: 1.7% over 1980-90, 2.1% over 1970-97 (growth in agriculture)
Annual GDP Growth Rate • SSA: 1.7% over 1980-90, 2.1% over 1970-97 (growth in agriculture) • East Asia: 7.8% over 1980-90, 9.9% over 1970-97 (growth in industry) • Real GDP Growth • SSA: 3% in the late 1970s 1% in the following decade • GDP Per Capita • SSA: decline since the early 1980s • HPAEs: maintain positive per capita growth rates since 1960s
Overview of Development Performance in SSA - African countries had relatively large endowments of natural resources and hence were expected to encounter significantly higher rates of economic growth in the post-independence period. - In Sub-Saharan Africa ended up being the poorest, most heavily indebted countries in the world. Poverty is still escalating while many African countries continue to spend more on debt repayments than they do on health care for their people. The debt crisis in the late 1970s prompted the private sector to cease lending to SSA countries by the beginning of the 1980s. - The decade of the 1980s was a period of a hostile global environment for Africa as the industrialized Western countries began to resort to increasingly protectionist trade policies while the oil shocks induced recessions in their own economies. African nations soon faced rising OECD trade barriers in addition to declining living standards.
Growth - Much of the SSA growth was in agriculture, most East Asian growth was in industry. In SSA, real GDP growth has seen a general decline from about 3% in the late 1970s to about 1% in the following decade, recovering only slightly in the 1990s. - GDP per capita has been declining since the early 1980s. • Capital Investment and FDI - In SSA as the investment rate declined in the 1980s, productivity fell sharply and had a negative impact on growth. Contribution of education, although lower than East Asia, has been similar to that of South Asia. - The contribution of physical capital is very strong in East Asia than in South Asia and even negative in SSA. - For most African countries, various strategies to attract FDIs have not succeeded insofar as in the absence of large domestic markets, investors are attracted mainly by the potential to extract low-processed products and export to industrialized countries in Europe and North America.
Trade and Industrialization - East Asian economies successfully undertook the transition from import-substitution to export-led industrialization between 1960-1975 when SSA was deeply entangled into ISI. What is noteworthy is that East Asia economies undertook the critical transition when the world economy was extremely conducive to trade and exports and, more importantly, when the international division of labor was experiencing a drastic shift. • Industrialization and Technology - Countries such as Botswana, Cote d'Ivoire, and Kenya invested productively in agriculture, but other African countries turned away from their primary export base. In contrast to Southeast Asia, foreign exchange shortages hampered industrialization efforts. Because protection and other policies insulated manufacturing from the disciplines of the markets, it was possible to start industries and employ technologies that were not always closely related to the resource and factor endowments in Africa.
Gross National Savings (GN Savings in % of GDP) and Investment (in % of GDP) in SSA Source: International Monetary Fund, World Economic Outlook Database, September 2005 • Savings rates in Africa (16% of GDP) have followed an erratic trend and remained lower than investment rates (19% of GDP).
Foreign Aid as a Catalyst for Development Source: OECD Development Centre / African Development Banks, 2008
International Trade and Competitiveness • SSA • Africa’s share in world trade has been falling since 1980. • SSA’s competitiveness in world markets has been eroded in the • last three decades. • Its poor external performance • Trade as a percentage of GDP: Nigeria 21.5%, South Africa 20.7%
Economic Development in Africa-Political Economy • Roots of African Poverty • Environmental limitations and slavery • Failed Development Policies Economic nationalism: inefficient, often corrupt governments took over large segments of economy • Corruption Kleptocracy: a state in which corruption is so institutionalized that politicians and government bureaucrats siphon off huge percentage of country’s wealth
Links to the World Economy • Most African exports are to EU or to U.S. • Low connectivity: few phones and TVs (40/1000 people) Multinational providers now competing for mobile-phone customers. • Aid Versus Investment: More aid than investment; Poverty and political instability discourage investment. • Debt Relief / Debt Crises: World Bank/IMF will reduce debt for countries with “unsustainable” debt burdens. Savings can be used for basic services.