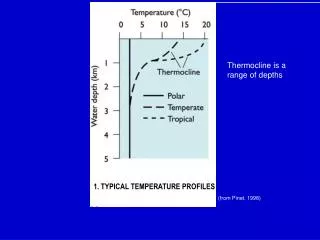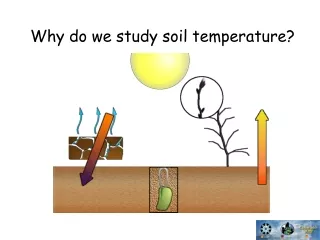
Soil Temperature Profiles
90 likes | 240 Vues
Explore the diurnal vertical heat transmission from solar inputs in soil through an animated simulation. Learn about heat pulses, thermal conductivity, moisture content, and organic matter's influence on heat conduction in clay loam soils. Investigate the effects of varying soil properties on surface temperatures and thermal gradients with depth.

Soil Temperature Profiles
E N D
Presentation Transcript
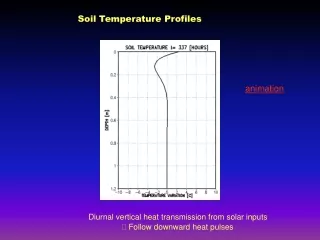
Soil Temperature Profiles animation Diurnal vertical heat transmission from solar inputs Follow downward heat pulses
Soil T Exercise – Data2 obs for each of 3 quadrants around shade tree Plot values – Can you explain the change with depth (delta = T vertical gradient) for each site, why these depth profiles differ among sites, and differences in surface temperatures at the surface across sites?
Thermal conductivity is dependent on….? Thermal conductivity as a function of soil density for loam at three moisture contents (MC) Why increasing, e.g., with compaction?
Soil thermal conductivity of clay loam as a function of organic matter content Why decreasing with OM?
Soil thermal conductivity of clay loam as a function of concentrations of NaCl and CaCl2 solutions As salt concentration increases free water energy decreases thermal conductivity decreases
Fire and thermal effects • Heat transmission from fire event • VOC translocation
oxidizing effect of water logging reducing Redox oxidized form reduced form DRY effect of pH reducing oxidizing WET