SlideServe
Menu
Préférences
© SlideServe · v2026

One-Year Survival Rates of Incident Renal Replacement Therapy Patients in the UK (2004-2010)

wendi avatar
33 diapositives · 458 Views · Sep 01, 2014

This report analyzes the one-year survival rates of incident patients undergoing renal replacement therapy (RRT) within the UK from 2004 to 2010. It examines survival trends by modality, age groups, and the effects of diabetes on patient outcomes. The study adjusts data to an age of 60 to provide a clearer understanding of mortality rates post-treatment initiation. Key findings reveal significant differences in survival based on the first modality of treatment and highlight the impact of age and comorbidities on patient longevity.
One-Year Survival Rates of Incident Renal Replacement Therapy Patients in the UK (2004-2010) - slide 1
01 / 33One-Year Survival Rates of Incident Renal Replacement Therapy Patients in the UK (2004-2010)
1 / 17

Télécharger la présentation

One-Year Survival Rates of Incident Renal Replacement Therapy Patients in the UK (2004-2010)
Une image / un lien ci-dessous est fourni (tel quel) pour télécharger la présentation

Politique de téléchargement : le contenu du site vous est fourni TEL QUEL pour votre information et votre usage personnel ; il ne peut être vendu, concédé sous licence ni partagé sur d’autres sites sans l’accord de son auteur.Le contenu vous est fourni TEL QUEL, pour votre information et votre usage personnel uniquement. Téléchargez la présentation en cliquant sur ce lien. Lors du téléchargement, si vous ne parvenez pas à télécharger une présentation, l’éditeur a peut-être supprimé le fichier de son serveur.Pendant le téléchargement, si vous ne parvenez pas à obtenir une présentation, le fichier a peut-être été supprimé par l’éditeur.

F I N

Plus de contenu associé

Transcription de la présentation
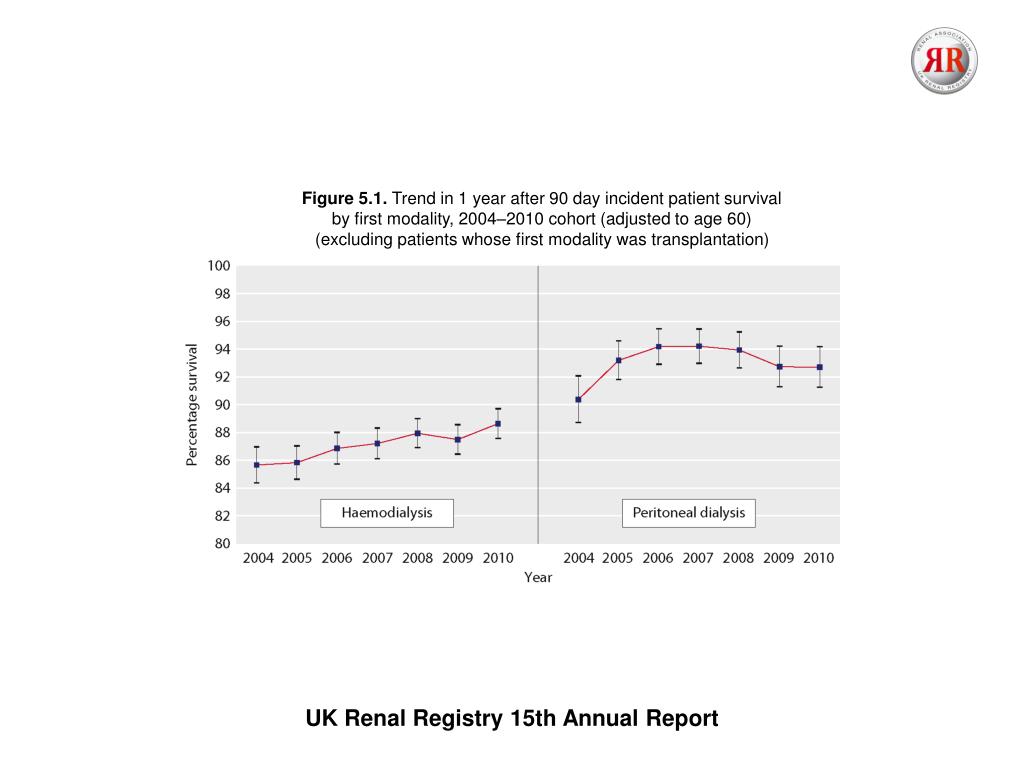
  1. Figure 5.1. Trend in 1 year after 90 day incident patient survival by first modality, 2004–2010 cohort (adjusted to age 60) (excluding patients whose first modality was transplantation) UK Renal Registry 15th Annual Report

  2. Figure 5.2. Unadjusted survival of incident patients by age group, 2010 cohort UK Renal Registry 15th Annual Report

  3. Figure 5.3. One year after 90 days death rate per 1,000 patients years by UK country and age group for incident patients, 2007–2010 cohort UK Renal Registry 15th Annual Report

  4. Figure 5.4. Survival of incident patients (unadjusted), 1997–2010 cohort (from day 0), without censoring at transplantation UK Renal Registry 15th Annual Report

  5. Figure 5.5. Survival of incident patients (unadjusted), 1997–2010 cohort (from day 90), without censoring at transplantation UK Renal Registry 15th Annual Report

  6. Figure 5.6. First year monthly hazard of death, by age group 1997– 2010 combined incident cohort UK Renal Registry 15th Annual Report

  7. Figure 5.7. One-year incident death rate per 1,000 patient years by age group, 1997–2010 cohort UK Renal Registry 15th Annual Report

  8. Figure 5.8. Change in long term survival by year of starting RRT, for incident patients aged 18–64 years UK Renal Registry 15th Annual Report

  9. Figure 5.9. Change in long term survival by year of starting RRT, for incident patients aged >65 years UK Renal Registry 15th Annual Report

  10. Figure 5.10. Long term survival of incident patients by gender, 2000–2008 combined cohort, adjusted to age 60 UK Renal Registry 15th Annual Report

  11. Figure 5.11. Six monthly hazard of death, by vintage and age group, 1997–2010 incident cohort after day 90 (not censored at transplantation) UK Renal Registry 15th Annual Report

  12. Figure 5.12. Six monthly hazard of death, by vintage and age group, 1997–2010 nondiabetic incident cohort after day 90 (not censored at transplantation UK Renal Registry 15th Annual Report

  13. Figure 5.13. Six monthly hazard of death, by vintage and age group, 1997–2010 diabetic incident cohort after day 90 (not censored at transplantation) UK Renal Registry 15th Annual Report

  14. Figure 5.14. Change in one-year after 90 day survival, 2000–2010 incident cohort (adjusted to age 60) Showing 95% confidence intervals UK Renal Registry 15th Annual Report

  15. Figure 5.15. Survival one-year after 90 days, adjusted to age 60, 2010 incident cohort UK Renal Registry 15th Annual Report

  16. Figure 5.16. Funnel plot for age adjusted 1 year after 90 days survival, 2007–2010 incident cohort UK Renal Registry 15th Annual Report

  17. Figure 5.17. The effect on survival after sequential adjustment for age, PRD and comorbidity, 2006–2010 incident cohort UK Renal Registry 15th Annual Report

  18. Figure 5.18. Survival at 90 days for incident diabetic and nondiabetic patients by age group for patients starting RRT in 2010 UK Renal Registry 15th Annual Report

  19. Figure 5.19. Survival at 1 year after 90 days for incident diabetic and non-diabetic patients by age group for patients starting RRT in 2010 UK Renal Registry 15th Annual Report

  20. Figure 5.20. Long term survival for incident diabetic and nondiabetic patients by age group, cohort 2000–2008, followed up for a minimum of 3 years UK Renal Registry 15th Annual Report

  21. Figure 5.21. One year survival of prevalent dialysis patients by age group, 2010 cohort UK Renal Registry 15th Annual Report

  22. Figure 5.22. One year survival of prevalent dialysis patients aged under 65 by centre, 2010 cohort UK Renal Registry 15th Annual Report

  23. Figure 5.23. One year survival of prevalent dialysis patients aged 65 years and over by centre, 2010 cohort UK Renal Registry 15th Annual Report

  24. Figure 5.24. One year survival of prevalent dialysis patients by centre adjusted to age 60, 2010 cohort UK Renal Registry 15th Annual Report

  25. Figure 5.25. One year survival funnel plot of prevalent dialysis patients by centre adjusted to age 60, 2010 cohort UK Renal Registry 15th Annual Report

  26. Figure 5.26. One year death rate per 1,000 patient years by UK country and age group for prevalent dialysis patients, 2010 cohort UK Renal Registry 15th Annual Report

  27. Figure 5.27. Serial 1 year survival for prevalent dialysis patients by UK country, 1999 to 2010 cohort years, adjusted to age 60 UK Renal Registry 15th Annual Report

  28. Figure 5.28. Relative risk of death in all prevalent RRT patients in the 2010 cohort compared with the UK general population UK Renal Registry 15th Annual Report

  29. Figure 5.29. Percentage contribution to cause of death for prevalent dialysis patients, 2010 cohort UK Renal Registry 15th Annual Report

  30. Figure 5.30. Percentage contribution to cause of death for prevalent transplant patients, 2010 cohort UK Renal Registry 15th Annual Report

  31. Figure 5.31. Cause of death in prevalent RRT patients by cohort year UK Renal Registry 15th Annual Report

  32. Figure 5.32. Median life expectancy on RRT by age group, incident patients starting RRT from 2000–2008 cohort UK Renal Registry 15th Annual Report

  33. Figure 5.33. Median life expectancy on RRT by age group, incident diabetic patients starting RRT from 2000–2008 cohort UK Renal Registry 15th Annual Report