Download
1 / 75
750 likes | 768 Vues
The effect of EU liberalization scenarios on export between Israel and the EU-W20. Submitted by Amir Heiman Yacov Tsur Presentation of the final report Montpellier – May 18. The effect of EU liberalization scenarios on export between Israel and the EU.

E N D
The effect of EU liberalization scenarios on export between Israel and the EU-W20. Submitted by Amir Heiman Yacov Tsur Presentation of the final report Montpellier – May 18
The effect of EU liberalization scenarios on export between Israel and the EU. • This study aims at estimating the effects of different EU liberalization scenarios on the exports to the EU of horticulture products from the following Mediterranean countries: Turkey, Tunisia, Morocco, Egypt and Israel. • In addition to other techniques, the liberalization is being studied using the Delphi survey technique.
The crop sectors as a whole export 38% of output value while the livestock sectors export only 1.2%. • The most export-oriented sector is the flowers industry that obtains 76% of its revenues from exports, followed by citrus, vegetables and fruits (orchards). • The citrus sector has been reduced dramatically since it heyday during the 1960s and is now only ninth in size.
Fruits production (orchards not including citrus) grew at the highest rate (15.7%). • Vegetables production increased somewhat above average, while citrus continues to decline. • Flowers production grew by more than 37%, but this increase was offset by a decline in prices
The production of vegetables increased by 9.9% during 2004 – above 9.3% growth rate of agricultural sector as a whole. • The largest increase is in vegetables for intermediate produce and for local manufacturing. • In contrast (or perhaps as a result) the average vegetables price has declined.
Fruits • While area of fruits orchards has hardly changed between 1990 and 2004 , output dropped by 41%. • However, production of fruits excluding citrus actually recovered between 2002 and 2004. • The share of fruits export increased. Production of the avocados and persimmons alternate between abundance years and shortage years.
Estimation of the impact of liberalization scenarios • The expected effects of the two liberalization scenarios are estimated using the Delphi survey technique • The Delphi survey technique uses a panel of experts to forecast impacts of various policy measures. • The method is quite simple. • In the first step the responder is asked to answer to the questionnaire. • The second step will be held shortly after that, and will include another round of questions • A panel of experts are chosen and they are asked to provide their estimates.
Delphi methodology was developed in the 60’s at Rand Cooperation. The name was taken from the Greek mythology where the oracle could predict future events The methodology of Delphi research design in presented in the next slide Methodology
Delphi Forecasting (Basu and Schoder, 1977) Questionnaire Data Formulation of first round questionnaire Expert Panel selection Distribution and collection of responses Statistical analysis Formulation of next round questionnaire Final estimation and circulation • Note: • Delphi aims at long range forecasting of technological trends. • The process is repeated until a group agreement is obtained • Optimal number of experts: 15 - 20
Highlights on Delphi methodology • The Delphi methodology is based on expert panel • Every participant is supposed to give his/her best estimate to future scenario without knowing who are other members of the panel. • Calibration of estimates is the most fragile part of this research- the second round provides each responder with information about the average and standard deviation of the entire sample
We assume that if the prior beliefs are strong than the new information will be discounted, i.e., get a small weight and vise versa. • To guarantee high validity the questionnaire was administrated via mail (or email).
Choice of products • The five products selected for the Expert Panel study are tomatoes, potatoes, pepper, table grapes, and strawberries. • We note that given their weights in the Israeli exports, both avocado and flowers are more important than strawberries and grapes.
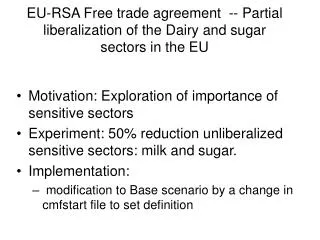
The liberalization scenarios considered in this project, according to which the Delphi questionnaires were prepared, are summarized below.
Sample description • We chose responders who could give reliable valuation based on experience, e.g., mangers of export firms, policy makers in the Ministry of Agriculture and extension service members.
We identified 35 potential responders and (after convincing their mangers to authorize their participation in the study) sent them the questionnaire by mail and email. • We received 29 responses (5 replied that they are not knowledgeable enough to handle this mission and 1 declined). • Since responders were instructed to answer only questions in their field of expertise and the number of experts is not the same across all product categories, we obtained uneven number of responses for the different categories.
Second Round • After receiving the first-round questionnaires and processing the information, we sent a revised questionnaire that contained descriptive statistics (mean, standard deviation, maximum and minimum values). • The responders were informed that they may revise their initial evaluation, but if they are confident in their initial evaluation then they should stick to it (for Israelis this goes without saying). • Only four responders out of 29 revised their initial evaluations.
The Panel • The questionnaire was sent by mail to 35 experts. • 29experts responded, some responded partially • Sample size classified by product :
First Round- Tomatoes, cherry tomatoes and other tomatoes. • The production of tomatoes in 2003 in Israel was 378000 tones. In 2004 it was 496000 tones. What will be the potential of the production of tomatoes, cherry tomatoes and other tomatoes in 2008 relative to 2004 ( -30%, -10%,-5%, 0%, + 5%, +10%, +30% other___) and in 2015 relative to 2004 ( -30%, -10%,-5%, 0%, + 5%, +10%, +30% other___).
Second Round – example of tomatoes • The production of tomatoes in 2003 in Israel was 378000 tones. In 2004 it was 496000 tones. What will be the potential of the production of tomatoes, cherry tomatoes and other tomatoes in 2008 relative to 2004 ( -30%, -10%,-5%, 0%, + 5%, +10%, +30% other___) and in 2015 relative to 2004 ( -30%, -10%,-5%, 0%, + 5%, +10%, +30% other___). • Results of the first round • Minimum Maximum Mean Std. Deviation • Production Potential 2008 10 50 20.28 10.64 • Production Potential 2015 -20 100 21.94 24.80 • The EU quota in 2004 was 10000 tons. Import tax inside the quota is 0% and above the quota an import tax of 8.8%-14.4% is applied (the higher tax is applied in the summer). In 2004 the export was of 15333 tons. Suppose that under a partial liberalization scenario the quota increases to 20000 tons. All other barriers are held constant. What do you think will be the impact of this step on the export of tomatoes, cherry tomatoes and other tomatoes? • The quantity exported to the EU will increase to ________ • Results of the first round • Minimum Maximum Mean Std. Deviation • Export quantity 2008 10,000 30,000 21,647 5,159 • The FOB price, which was on average $1700 per ton will change as a result of changes in quantity in 2008 to _________ • Minimum Maximum Mean Std. Deviation • Price FOB 2008 1,300 3,000 1,661 355
Comparing the first and the second round • This updating procedure gives rise to a lower standard deviation and drives averages to their “true value”, i.e., their value under perfect information. • It is hard to expect that the upper limits will increase and the lower limits will decrease since the responses are converging toward the center (mean). • The results indicate that the minimum values were raised (moving to the center) in three of the five categories (tomatoes, pepper and potatoes). • The maximum value was not changed except for grapes in one case (export in 2008) where the new information affected results in the opposite way, i.e., larger disagreement.
The responders did not change their valuation of the potential production and thus changes in these figures will not be presented. • The standard deviations became smaller and changes were made more frequently in the quantities under the two scenarios of liberalization.
Tomatoes –Panel Forecast- Quantity • Production in 2008 - 610 thousand tones (512 in 2004) and 624 thousand tones in 2015. • The exported quantity for the partial liberalization scenario is 22300 tones (21 in 2004) and with full liberalization the export will reach 27000 tones – a 28% increase. • The experts thus estimated that the share of export will increase as the quota is doubled (from 10000 to 20000 tones).
Tomatoes –Panel Forecast- Price • The current tomatoes FOB price is 1700 euro per tone. • The panel expected a decline to 1661 euro per tone in 2008 and 1441 euro per tone in 2015 -- a decline of 2.3% and 13.5% respectively.
Pepper –Panel Forecast- Quantity • The panel forecasted that production in 2008 will be 152 thousand tones (127.6 in 2004) and will reach 158 thousand tones in 2015. • Pepper export in the partial liberalization scenario is estimated at 68895 tones (In 2004 Israel exported 53700 tones, of which 40929 went to the EU) • With full liberalization the export will reach 88579 tones- increase of 65%.
Pepper - effect of increase in quantity exported on prices • The current FOB pepper price is in the range of 1200 – 1500 euro per tone. • The experts forecast that the increase in quantity will result in sharp decline of price. • The price is expected to decline to 1234 euro per tone in 2008 and 1158 euro per tone in 2015 with full liberalization.
Potatoes -the panel forecast • The panel forecasted 637 thousand tones production in 2008 (570.8 tones in 2004) and 669 thousand ton in 2015. • The exported quantity for the partial liberalization scenario is 263250 tones (251000 tones in 2004, of which 224156 tones are exported to the EU) and with full liberalization the export will reach 307250 tones – an increase of 22.4%.
Potatoes panel forecast -Price • The current FOB potatoes price is in the range of 220 euro per tone The price is expected to decline to 218 euro per tone in 2008 and increase to 298 euro per tone in 2015 after full liberalization. • The two price estimates are not straightforward. In the current price of 220 euro per tone the profitability of exporting potatoes is questionable, thus a larger export under a lower price is, at best, odd. • The price in 2015 is supposed to increase while the quantity continues to increase. This will happen if potatoes production becomes more efficient or demand shifts upward
Grapes -panel forecast • The production of grapes in 2008 will be 88.8 thousand tones (73.5 in 2004) and will reach 92 thousand tones in 2015. • The exported quantity under the partial liberalization scenario is 11546 tones (compare with 6700 tones export to the EU in 2004) and will reach 19667 tones under full liberalization - increase of 72% and 193%, respectively
Grapes-Price • The current rapes FOB price is around 1800 -1600 euro per tone. • The price is expected to decline to 1150 euro per tone in 2008 and increase slightly to 1170 euro per tone in 2015. • Again the increase of price between 2008 and 2015 is not easy to explain.
Strawberries-Panel forecast -quantity • The panel forecast that the production of grapes will be 20.5 thousand tones in 2008 (compare with 17.6 thousand tones in 2004) and 21.2 thousand tones in 2015. • The exported quantity for the partial liberalization scenario is estimated at 3353 tones (compare with 2900 tones of export to EU in 2004) and under full liberalization the export will reach 4179 tones- and increase of 16% and 44% respectively. • The growth of export due to liberalization is very modest (about 500 tones under partial liberalization and 800 tones under full liberalization). The effective constraint is the intensive labor input in production
Strawberries-Panel forecast -Price • The current FOB price is about 5000 euro per tone. • The experts' panel thinks it will decline to about 4167 euro per tone in 2008 and 3787 euro per tone in 2015 under full liberalization.
Closing comments Issues that raised Concerns • The study covers effects on the export of Israeli agricultural products to the EU but ignores the possibility of import from EU (and other Mediterranean countries) to Israel. • Another issue that surfaced during the interviews was the choice of the product categories. Most experts were puzzled why flowers – a major export crop – were not part of the survey and why strawberries were included.
Trade liberalization is excepted to increase Israeli export agricultural products to the EU by about 12-60% and decrease prices by 3%-15% . • We believe that experts’ forecasts are based on partial aspects of liberalization.
Tomatoes, cherry tomatoes and other tomatoes. • The production of tomatoes in 2003 in Israel was 378000 tones. In 2004 it was 496000 tones. What will be the potential of the production of tomatoes, cherry tomatoes and other tomatoes in 2008 relative to 2004 ( -30%, -10%,-5%, 0%, + 5%, +10%, +30% other___) and in 2015 relative to 2004 ( -30%, -10%,-5%, 0%, + 5%, +10%, +30% other___).
Tomatoes, cherry tomatoes and other tomatoes. • The production of tomatoes in 2003 in Israel was 378000 tones. In 2004 it was 496000 tones. What will be the potential of the production of tomatoes, cherry tomatoes and other tomatoes in 2008 relative to 2004 ( -30%, -10%,-5%, 0%, + 5%, +10%, +30% other___) and in 2015 relative to 2004 ( -30%, -10%,-5%, 0%, + 5%, +10%, +30% other___).
Tomatoes, cherry tomatoes and other tomatoes. • The EU quota in 2004 was 10000 tons. Import tax inside the quota is 0% and above the quota an import tax of 8.8%-14.4% is applied (the higher tax is applied in the summer). In 2004 the export was of 15333 tons. Suppose that under a partial liberalization scenario the quota increases to 20000 tons. All other barriers are held constant. What do you think will be the impact of this step on the export of tomatoes, cherry tomatoes and other tomatoes? • The quantity exported to the EU will increase to ________ • The retail price, which was on average in between 2200-1700 EURO per ton will change as a result of changes in quantity in 2008 to _________
Tomatoes, cherry tomatoes and other tomatoes. Export 21500 TonsFob 1700 Euro