Download
1 / 19
190 likes | 333 Vues
CREATE – National Evaluation Institute Annual Conference – October 8-10, 2009 The Brown Hotel, Louisville, Kentucky Research and Evaluation that inform Leadership for Results. Masking Variations in Achievement Gains By Eliot R. Long

E N D
CREATE – National Evaluation InstituteAnnual Conference – October 8-10, 2009The Brown Hotel, Louisville, KentuckyResearch and Evaluation that inform Leadership for Results Masking Variations in Achievement Gains By Eliot R. Long A*Star Audits, LLC - Brooklyn, NY 11231 eliotlong.astaraudits.com
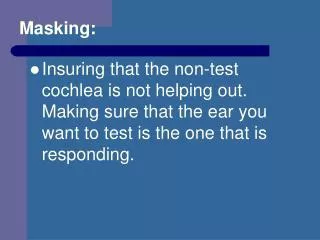
Teacher encouraged guessing:Unstructured influence on student test item responses An accepted practice • Recommended by educational assessment writers • Supported by extensive research – since the early 1920’s • A common practice in schools across the U.S. - Assessment mantra: “If it’s blank, it’s wrong” • Informal, entrepreneurial teacher activity – no written policy or instructions how to – or not to - do it Yet, no evaluation of impact on program evaluation or accountability • No study of effects on low performing students • No study of impact on comparison of test scores over time • No study of recommendations put into general practice
A Norms Review The following exhibits are based on four separate research projects, each including the development of group response pattern norms - Classroom groups, grades 3-7 in a northeast urban school district 15,825 classrooms, 391,078 students - School groups, grade 3 statewide in Midwest 2,317 schools, 140,203 students - Nationwide sample, grade 4 A test section of the 2002 NAEP Reading 36,314 students - Job applicant groups across the U.S. 87 employers, 447 employer groups, 32,458 job applicants
Percent Correct &Test Completion Teacher Administered TestsNon-teacher Administered Tests Pct. Pct. Attp. Pct. Pct. Attp. Test-Takers Correct All Questions Test-Takers Correct All Questions Northeast 1999-2001 Independent Proctor Administered Urban School District – Reading Tests NAEP Reading 2002 Grade 3 68.6% 97.4% Grade 4 67.6% 60.9% Grade 4 74.7% 96.7% Grade 5 65.5% 93.6%Employer Administered 1996-1999 Grade 6 67.4% 93.1% Verbal Skills Grade 7 71.0% 96.4% Job Applicants 82.0% 44.0% Midwest 2001 Quantitative Skills Statewide – Math Test Job Applicants 75.2% 28.2% Grade 3 63.5% 97.4% “If it’s blank, it’s wrong.”No encouraged guessing
Test Completion: A Teacher/Proctor Effect Answers left blank are concentrated by classroom 15.6% of all classrooms account for 77.6% of all answers left blank. 5.6% of all classrooms account for 48.0% of all answers left blank. Grade 5 Reading 45 items – 4 alternative, multiple-choice All Classes ‘Low Blanks’ Classes ‘High Blanks’ Classes < 26 Ans. Left Blank 26+ Ans. Left Blank Class Blanks Pct. Attp. Blanks Blanks Pct. of All Standing Classes Per Class All Ques. Classes Per Class Classes Per Class Classes Blanks 4th Q. 617 1.8 97.3% 613 1.6 4 34.3 0.6% 12.0% 3rd Q. 620 4.5 94.9% 599 3.2 21 43.3 3.4% 32.5% 2nd Q. 619 6.1 93.1% 580 3.7 39 42.0 6.3% 43.5% 1st Q. 619 10.4 90.1% 544 4.3 75 54.6 12.1% 63.8% All 2,475 5.7 94.0% 2,336 3.1 139 48.8 5.6% 48.0% -------------------------------------------------------------------------------------------------------- Pct. Correct 65.5% 65.9% 59.3% Pct. Attp. All 94.0% 95.1% 74.0%
Tale of Two Classes:Number Attempted by Number Correct Two classrooms at the same class average score with and without encouraged guessing. Class: n = 21, Blanks = 3 Class n = 21, Blanks = 199 RS Avg. = 19.4 SD = 4.3 RS Avg. = 19.4 SD = 7.9 KR-20 = .53 – Pct. Blank = 0.3% KR-20 = .89 – Pct. Blank = 21.1% The Norm of Classroom Test Administration The Exception
NAEP & Job Applicants:Number Attempted by Number Correct Independent Test Administrators Employer Administered NAEP 2000 Grade 4 ReadingTest of Basic Verbal Skills Students leave many answers blank Job applicants leave many answers blank Pct. correct of attempts = 67.6% Pct. correct of attempts = 75.1% Pct. attempt all questions = 60.9% Pct. attempt all questions = 1.8%
Correlation Analysis:Number Attempted - Number Correct Teacher AdministeredAll StudentsStudents with Blanks =>5 Grade 5 Reading r = .153 n = 66,320 r = .527 n = 1,094 Grade 5 Math r = .110 n = 69,413 r = .549 n = 238 Grade 6 Reading r = .162 n = 62,524 r = .583 n = 658 Grade 7 Reading r = .202 n = 58,915 r = .597 n = 1,416 Independent Test Administrator NAEP Grade 4 Reading r = .608 n = 36,314 Employer Administered Job Applicants Test of Verbal Skills r = .717 n = 32,458 Test of Quantitative Skills r = .581 n = 31,629 Hovland and Wonderlic (1939) Adult workers & students Otis Test of Mental Ability 4 test forms & 2 time limits r = .608 to .723 n = 125 to 2,274 (8 variations)
Location of Answers Left Blank Recommendations to encourage guessing presume that most answers left blank are imbedded; that is, they represent questions that are addressed and, for some reason, skipped. Our norms reveal that most blanks are trailing; that is, they represent questions that are not reached during the time limit. Position of Blanks ImbeddedTrailing Grade 5 Reading 22.3% 77.7% NAEP Grade 4 Reading 15.8% 84.2% Job Applicant Verbal Skills 5.2% 94.8% Teachers must significantly change students’ test work behavior to achieve answers to ‘not reached’ questions. How?
Test Score Reliability (KR-20) by Classroom Teacher involvement in their students’ test work behavior to encourage guessing is entrepreneurial, often undermining test score reliability. 50+ Answers Left Blank No Answers Left Blank 42 classrooms at and below average 330 classrooms at and below average likely to have little encouragement to guess likely to have extensive encouragement to guess
The volume of teacher encouraged guessing Parsing Grade 5 number correct scores: The traditional correction-for-guessing: S = R – W/(n-1) For the number correct score at the minimum for Basic (R = 18): S = 18 – 27/(4-1) = 18 - 9 S = 9 Result: Half of the number correct score is due to random guessing. S = True Score R = Number Right W = Number Wrong n = Number of Answer Choices Grade 5 Reading: 45 items 4 ans. alternatives RS 18 = Min. Scale Score For ‘Basic’ - just passing
Success rate: A norms approach The traditional correction-for-guessing formula assumes that 100% of skills based answers are correct. A regression of median percent correct on number attempted for test-takers who leave 5+ answers blank finds a variable rate of success: Regression of Median Pct. Correct on Number Attempted Test-Takers Number Data Pts R squared Constant Slope Grade 5 Reading 1,449 7* .699 0.321 0.0091 Grade 6 Reading 1,486 7* .877 0.416 0.0065 Grade 7 Reading 1,269 7* .703 0.468 0.0040 Job Applicants 15,650 25** .905 0.465 0.0094 or Percent Correct = 0.465 + 0.0094*As where As represents the number of questions answered based on the test-taker’s skills. * Number attempted ranges: Up to 15, 16-20, 21-25, 26-30, 31-35, 36-40, 41-45 ** Number attempted: 21 through 45
Add norms to The traditional formula = Empirical Approach Traditional formula: S = R – W/(n-1) or R = S + W/(n-1) skills + guessing Empirical formula: R = Pct. Correct*As + (At – As)/n or R = 0.0094*As2 + 0.465*As + (At – As)/n ---- skills ----- + guessing For a score of 18: 18 = (0.0094*17.72) + (0.465*17.7) + ((45-17.7)/4) = 2.945 + 8.23 + 6.825 18 = 11.175 + 6.825 skills + guessing Results: 39% (17.7/45) of answers are attempted based on skills 61% of answers are guessed due to teacher encouragement 38% of the observed score is based on encouraged random guessing Note: W = (At– As)*((n-1)/n) At = Total attempts = 45 As = Skill based attempts Solution: Substitute 45 for At and 18 for R, find As = 17.7
Observed and Estimated True Scores Grade 5 Reading Test: Distribution of Observed and Estimated True Skills Application of the ‘empirical’ parsing formula to the full distribution of Grade 5 scores*. Student Distribution MeanSD Observed 29.1 7.8 Est. True 26.4 9.4 Change +10.2% -16.5% Classroom Distribution Avg. MeanAvg. SD Observed 29.1 5.9 Est. True 26.0 7.4 Change +11.6% -19.9% * Random guessing outcomes are forecast by the binomial distribution and moderated by the variation in the volume of guessing with student skill level. The actual percent guessed correct is lower than expected among lower observed scores and higher than expected among higher observed scores.
Volume of encouraged guessingBy Performance Level Contribution of Encouraged Guessing To Student Scores Student Averages by Performance Level Grade 5 Reading Estimates for Random Guessing Average Average Pct. of Pct. of Student Pct. of Number Number Number All Performance Level StudentsCorrectAttemptedCorrectAnswers Level 4 Advanced 6.2% 42.1 45.0 0.0% 0.0% Level 3 Proficient 48.4% 34.1 44.9 5.3% 15.4% Level 2 Basic 37.1% 23.6 44.6 19.0% 42.8% Level 1 Below Basic 8.3% 14.4 44.1 44.1% 69.8% Levels 1-2 Basic & Below 45.4% 21.9 44.5 23.8% 47.1% All Students 100.0% 29.1 44.8 10.2% 26.7%
Encouraged guessing Creates a test score modulator Changes in skill and guessing move in opposite direction, offsetting in the total score. Comparison of First Test and Second Test Scores Test Answers Test Observed Based on Based on Guessing Administration Total Skills Guessing Contribution 1st Test Admin. Correct 18 11.2 6.8 37.8% Attempts 45 17.7 27.3 60.7% Pct. Correct 40.0% 63.3% 25.0% 2nd Test Admin. Correct 20 13.8 6.2 31.0% Attempts 45 20.1 24.9 55.3% Pct. Correct 44.4% 68.7% 25.0% Gain 2 2.6 -0.6 Pct. Gain 11.1% 23.2% 52% of true gain masked by guessing
Estimated Gain Masked by Guessing The ‘empirical’ formula may be applied to first test and second tests at each score level. Hypothetical Gains Parsed for Guessing Effects Number Correct Pct. Pct. Pct. Percentile First Second Observed Est. True True Gain Standing Score Score Gain Gain Masked_ 90% 39.0 42.9 10.0% 10.9% 8.3% 80% 36.0 39.6 10.0% 13.3% 24.9% 70% 34.0 37.4 10.0% 13.2% 24.2% 60% 32.0 35.2 10.0% 13.8% 27.3% 50% 30.0 33.0 10.0% 13.4% 25.6% 40% 27.0 29.7 10.0% 15.2% 34.1% 30% 25.0 27.5 10.0% 15.8% 36.7% 20% 22.0 24.2 10.0% 16.5% 39.2% 10% 18.0 19.8 10.0% 20.6% 51.5%
Findings of a Norms Review The informal practice of teacher encouraged guessing to complete all test answers has the following effects: 1. High volume of non-skills based test answers The volume of test answers thatresult from teacher encouragement is very high: 26% of all answers for students at the school district average and 50% or more among students most at risk of failing. 2. Teacher involvement lowers test score reliability Teacher involvement is unstructured, varying from classroom to classroom and from student to student, creating widely varying and generally lower test score reliability. 3. Guessed correct answers reduce the range of measurement Added guessing increases among lower performing students, raising their scores more than higher performing students and therefore narrowing the range of measurement by ~20%.
Findings of a Norms Review Continued 4. Guessing creates a test score modulator Changes in student achievement will cause changes in the volume of guessing – in the opposite, offsetting direction - modulating observed scores. This modulating effect masks variations in gain, by as much as 50% or more among low performing students. Teacher encouraged guessing narrows the window onto student achievement gains, while reducing both the range and reliability of the measurement that can be observed. As a consequence, non-skills related variation may predominate, misdirecting test score interpretation and education policy.