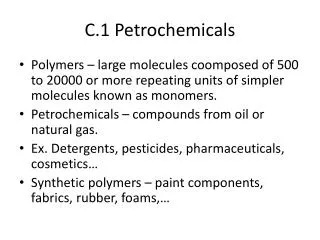
Download
1 / 16
170 likes | 770 Vues
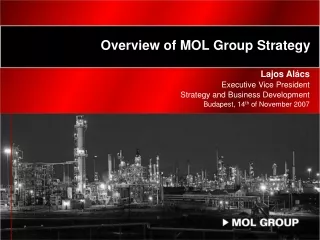
MOL Group Petrochemicals. Operationa l integration. DOWNSTREAM. UPSTREAM. E&P. Gas Transmission. R&M. Petrochemicals. TVK ( 86 . 8 % MOL 8.1% SN ). MOL Plc. S N (98.4% MOL ). SPC (100% SN). IES ( 100 % MOL ).

E N D
Operational integration DOWNSTREAM UPSTREAM E&P GasTransmission R&M Petrochemicals TVK (86.8% MOL 8.1% SN) MOL Plc. SN (98.4% MOL) SPC (100% SN) IES (100% MOL) INA (MOL47,15 %, Croatian government 44 %) MOL Group – A leading integrated oil and gas company • One of the bestperformingintegratedenergy companiesin the world • Leader in coremarkets ofHungary,Slovakia and inCroatia • State of the artasset baseservingahigh growthregion • Highly successfulregional partnerships:Slovnaft, TVK, INA, IES MOL plays a leading role in the Central European oil, gas and petrochemical business
MOL Group – A leading integrated oil and gas company Crude to plastic optimisation Unbundling Gas transmission E&P Petchem Other Energy R&M • UGS with 1.2 bcm strategic, 0.7 bcm commercial capacity • Enter to power business with CEZ • TSO in Hungary • 5,560 km high pressure gas pipeline operator • Petchem plants in Hungary and Slovakia • 880 kt ethylene capacity • 1.2 Mt polymer capacity • 5 refineries with total 470,000 bbl/day refining capacity • 1600+ filling stations • Producing assets in 7, exploration in 15 countries • 662 MMboe SPE 2P reserves • 135.5 Mboe/day production* Data • 2 refineries having one of the highest net cash margin in Europe since 2003** • Extensive crude and product pipeline system • Strong market position • Stable EUR-base return on storage business • Good geographical position • Growing demand in electricity • Stable cash-flow from regulated Hungarian transmission • Unregulated international transit • Good geographical position • Full operational integration with R&M • The largest integrated olefin and polymer player in CEE • 70-year experience in CEE, international presence for 20 years • Hungarian onshore operation has one of the highest net cash margin in Europe*** Competitive advantages • Smooth operation of UGS • Building TPP in Slovnaft Refinery • Nabucco • Alternative energy • Become a regional hub • Doubling transit volume • NETS • Production growth via strong development • Exploration activity to increase reserve base • Refinery upgrade projects to become premium refinery group in Europe • Joint optimisation of 5 refineries and 2 petchem units Growth drivers • Extend MOL’s outstanding efficiency to the whole group exploiting synergy potential Share from 2007-2009 EBITDA * MOL fully consolidate INA as of 30 June 2009, pro-forma 2009 data ** WoodMackenzie study (2003-2008) *** Herold
MOL Group -First mover in the regional downstream consolidation • 2003 - 2007:Retail expansion • Shell Romania – 2003 • Roth Company (Austria) - 2004 • 67% in Energopetrol with INA (BiH) - 2006 • Tifon (Croatia) - 2007 2009:Operational control over INA 2008:Acquisition of further 22.2% share in INA through a public offer 2007:Acquisition of IES (Italy) 2004:98.7% stake in Slovnaft via public offer 2003:Acquisition of 25.0% in INA 2002:Gain control over Slovnaft (70.0%) 2001:Gain control over TVK (34.5%) 2000:Acquisition of 32.9% of TVK, Acquisition of 36.2% of Slovnaft
ethylene sales naphtha, LPG, gasoil propylene polyolefins MOL Refining & Marketing Division Steam Crackers Polymer units LDPE HDPE PP Plastics producers olefin monomers pygas, H2 i-butene • Raw-materials processed in 2009: 2.2 million tons • naphtha: 1821 kt • LPG: 339 kt • gasoil: 52 kt • Polymer sales in 2009: 1.2 million tons • LDPE: 233 kt • HDPE: 394 kt • PP: 527 kt MOL Petrochemicals (TVK+SPC) • First choice supplier in domestic (H, SK) polyolefin markets • Strong positions in other CEE markets – nice positions in WE • SCM coordinated optimisation, fully integrated with Refining Petrochemical value chain structure MOL PETROCHEMICALS
R&M Petrochemicals Refining (naphtha, LPG, gasoil) Olefins (ethylene, propylene) Polymers (LDPE, HDPE, PP) Base transfers Petrochemicals – Crude to plastic optimization Petrochemicals is a significant risk mitigator in the hydrocarbon value chain Transfer to Petchem • Petrochemicals support R&M growth as captive market for excess gasoline through naphtha. • Current annual feedstock transfer of 2.3Mt from Refining to Petchem… • …and 0.6Mt from Petchem to Refining
Olefins Polyethylene (LD/HD) Polypropylene Ethylene sales ethylene * TVK Steam Cracker 1 370 ktpaLinde1975 TVK Steam Cracker 2 290 ktpaLinde2004 naphtha gasoil LPG TVKLDPE 1 32 ktpaICI1970 TVKLDPE 2 65 ktpaBASF1991 TVKHDPE 1 200 ktpaPhilips1986 TVKHDPE 2 220 ktpaMitsui2004 TVKPP 3 100 ktpaHimont1989 TVKPP 4 180 ktpaHimont1999 R E F I N E R I E S propylene by-products ethylene naphtha gasoil LPG propylene SPC Steam Cracker 219 ktpaABB Lummus1975 SPCLDPE 1 50 ktpaICI1964 SPCLDPE 2 40 ktpaICI1976 SPCLDPE 3 88 ktpaCDF1977 SPCPP 3 255 ktpaDow2005 propylene by-products MOL Petrochemicals: Key assets and product flows TVK, Tiszaújváros site SPC, Bratislava site *permanently shut down in 2009
Local presence of MOL Petrochemicals Focus markets: • Western Europe: niche position • Central Europe including: Hungary, Slovakia, Czech Republic, Poland, Romania, the Balkans (BG, BiH, CRO, SRB, CG, MAC, SLO), the Baltics (Latvia, Lithuania, Estonia) • EE: Ukraine R=1000 km circles with TVK/SPC in focal points
LDPE HDPE PP One of the largest polyolefin players in CEE Polyolefin capacities in the region* • Our competitive advantages: • efficient assets • up-to-date product portfolio • our integrated and optimised feedstock supply • strong regional position • proximity to rapid growth regions of Eastern Europe * Region contains: H, CZ, SK, PL, SLO, A, CRO, RO, BiH, SR, CG, MAC, GR, BG, UA, BLO, E-Germany, N-Italy
Polyolefins production capacity • Commodity products, competitive quality • Grades in portfolio for each major application area • Flexibility to develop tailor-made products
Applications • Strengths of LDPE: MFI (Melt Flow Index) in range 0,3 to 200(synonyms of Melt Flow Index are Melt Flow Rate and Melt Index) Grades of stable quality from autoclave and tubular process are available Film grades from tubular process shows very good optical properties, drawability and broad processing-window Special very high MFI grades from autoclave process are unique on European market
Applications • Strengths of HDPE MITSUI technology Excellent product quality ( Unimodal and Bimodal MWD) Outstanding combination of the mechanical properties: high tensile modulus combined with an ESCR, which is much higher than with standard unimodal HDPE blow moulding grades (potential for wall thickness reduction) Outstanding combination of excellent film impact strength and good processability at bimodal film resin ( potential for film thickness reduction), possibility to produce PE100 pipe grade • Strengths of HDPE PHILIPS technology Medium and high density polyethylene are produced by continuous suspension polymerization using low pressure catalytic process Density range of 0,934 – 0,955 g/cm3 High polymer purity and constant quality Possibility to produce PE80 pipe grade
Applications HHomopolymers: the result of the polymerization of a single monomer.A homopolymer consists of a single type of repeating unit. RCRandom Copolymers: a copolymer consisting of alternating segments of two monomeric units of random distribution, including single molecules. A random copolymer usually results from copolymerization of two monomers (propylene and about 7 weight percent ethylene) in the presence of a free-radical initiator. ICImpact Copolymers: contains about 22 weight percent ethylene for improve impact resistance of PP
Number of Commercially Produced Grades - 2010 *Catalogue grades