Detection of Explosives Using Image Analysis
30 likes | 224 Vues
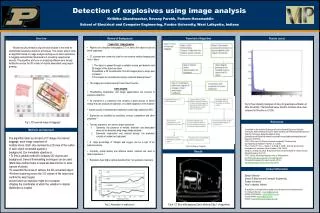
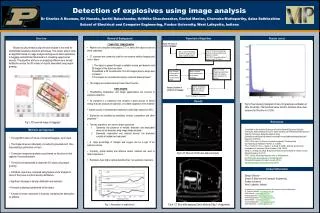
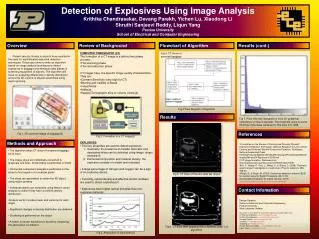
Detection of Explosives Using Image Analysis Krithika Chandrasekar , Devang Parekh, Yichen Lu, Xiaodong Li Shruthi Sanjeevi Reddy, Liqun Yang Purdue University School of Electrical and Computer Engineering. Flowchart of Algorithm. Results (cont.). Review of Background. Overview.

Detection of Explosives Using Image Analysis
E N D
Presentation Transcript
Detection of Explosives Using Image Analysis KrithikaChandrasekar, Devang Parekh, Yichen Lu, Xiaodong Li ShruthiSanjeevi Reddy, Liqun Yang Purdue University School of Electrical and Computer Engineering Flowchart of Algorithm Results (cont.) Review of Background Overview Recent security threats in airports have resulted in the need for sophisticated explosive detection techniques. This project aims to write an algorithm based on image analysis techniques to detect explosives in baggage and eliminate false alarms in screening equipment at airports. The algorithm will focus on analyzing differences in density distribution across the 3D volume of objects assembled using region growing. Fig 1. 3D scanned image of baggage(5) • COMPUTED TOMOGRAPHY (CT) • The formation of a CT image is a distinct two phase process. • •The scanning phase • •The reconstruction phase • CT images have five specific image quality characteristics. They are: • •Contrast Sensitivity (very high for CT) • •Blurring and visibility of Detail • •Visual Noise • •Artifacts • •Spatial (Tomographic slice or volume views)(2) • Fig 2. Formation of a CT image(2) • EXPLOSIVES • • Two key properties are used to detect explosives • Geometry: the presence of metallic detonator and associated wires can be detected using image shape analysis(4) • Elemental composition and material density: the explosive consists of oxidant and reductant • • A large percentage of nitrogen and oxygen can be a sign of an explosive device • • Currently, optical density and effective atomic numbers are used to detect explosives(1) • • Explosives have higher optical densities than non-explosive materials • Fig 3. Absorption of explosives(3) Input: CT slices of scanned baggage Fig 4 Flow Diagram of Algorithm Fig 7. Pixel intensity histogram of slice 20 (graphical verification of Otsu threshold). The threshold value found to minimize intra-class variance for this slice is 0.1255. Results Fig 5. CT Slice of Pan Am data set (Input) Fig 6. CT Slice after applying Otsu’s Method (Step 1 of algorithm) References 1Committee on the Review of Existing and Potential Standoff Explosives Detection Techniques, National Research Council, (2004). Existing and Potential Standoff Explosives Detection Techniques. National Academies Press. EmittingProducts/RadiationEmittingProductsandProcedures/MedicalImaging/Me dicalX-Rays/ucm115318.htm 2 CT image formation. Retrieved from http://www.sprawls.org/resources/CTIMG/module.htm#1 3Hu, Y., Huang, P., Guo, L., Wang, X., & Zhang, C. (2006). Terahertz spectroscopic investigations of explosives. Physics Letters A, 359, 728-32. 4Singh, S., & Singh, M. (2003). Explosives detection systems (EDS) for aviation security. Signal Processing, 83, 31-55. 5Computed tomography for airport security. (2010) http://www.analogic.com/about-us-overview.htm Methods and Approach • The algorithm takes CT slices of screened baggage, as its input • The image slices are individually converted to grayscale and Otsu thresholding is performed on them • Connected component analysis is performed on the slices to find regions of connected pixels • The slices are assembled to obtain the 3D object using region growing • Individual objects are compared using feature vector analysis to check if they have a uniform density distribution •Feature vector includes mean and variance for each object • Significant changes in density distribution are detected • Clustering is performed on the object • A match to known explosives is found by comparing the attenuation co-efficient Contact Infomation Danger Detector School of Electrical and Computer Engineering Purdue University West Lafayette, Indiana All questions or correspondence related to this document should be addressed to Dr Charles A Bouman – bouman@purdue.edu KrithikaChandrasekar – kchandra@purdue.edu Devang Parekh – dparekh@purdue.edu Yichen Lu – lu90@purdue.edu Xiaodong Li – li5@purdue.edu ShruthiSanjeevi Reddy – s.shruthi89@purdue.edu Liqun Yang – lyang@purdue.edu