Download
1 / 34
340 likes | 364 Vues
This session discusses the variations in monthly mean sea level, relative sea level trends, vertical land motion, analysis of extremes, frequency and duration of inundation, coastal storm response, tidal datums and long-term changes in range of tide, as well as online tools and impact studies related to the Delaware Estuary.

E N D
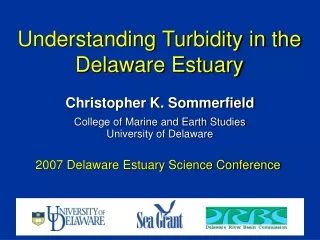
Long-term Variations in Tidal Characteristics and Sea-Level in the Delaware Estuary Stephen Gill, Allison Allen, Carolyn Lindley, William Sweet, Chris Zervas NOAA/NOS Center for Operational Oceanographic Products and Services, Silver Spring, MD Session 4 - Climate Change
Long-term Variations in Tidal Characteristics and Sea-Level in the Delaware Estuary Outline • Variations in monthly mean sea level • Relative sea level trends • Vertical land motion • Analysis of Extremes • Frequency and Duration of Inundation • Coastal Storm Response • Tidal datums and long-term changes in range of tide • On-line Tools and Impact studies
Delaware Bay NOAA National Water Level Observation Network (NWLON) and PORTS Observing Systems
At present rate, relative sea level will rise 0.36m from 2010 to 2100 at Cape May
At present rate, relative sea level will rise 0.29m from 2010 to 2100 at Lewes
At present rate, relative sea level will rise 0.31m from 2010 to 2100 at Reedy Point
At present rate, relative sea level will rise 0.25m from 2010 to 2100 at Philadelphia
Estimating the Vertical Land Motion Component from Tide Station Records • Construct a “Regional” oceanographic • composite from the tide stations in a region • Subtract out the 1.7mm/yr 20’th century rate • (IPCC2007) Regional Oceanographic Signal Estimated vertical land motion Estimated vertical land motion Estimated vertical land motion Estimated vertical land motion
Locations of NGS Continuously Operating Reference Systems (GPS-CORS) Direct measurements of vertical land motion can be obtained using continuous GPS observations. NGS is currently updating vertical velocities from the national CORS network which can be compared to the indirect estimation method in the previous slides.
Exceedance Probabilities Relative to Elevations of Tidal Datums
Exceedance Probability Curves with 95% Confidence Intervals Elevation relative to MHHW (meters) Log scale of recurrence interval (in years and percent)
It takes 6.4 hours for high tides and 8.1 hours for low tides to progress up river to reach Trenton from Lewes. The mean range of tide increases from 1.24m (4.1 ft) at Lewes to 2.49m (8.2 ft) at Trenton
The Delaware River had been dredged to a depth of 18 ft by the late 1800s. By the 1940s, the USACE had deepened the navigational channel from Philadelphia to the ocean to a depth of 40 ft. The channel upstream from Philadelphia was then dredged to 40 ft.
Tools for Assessing Impacts of Sea Level Rise http://csc-s-web-p.csc.noaa.gov/de_slr/
US DOT Impact Study This study was designed to produce high level estimates of the net effect of sea level rise and storm surge on the national transportation network. It was designed primarily to aid policy makers at the U.S. Department of Transportation by providing estimates of these effects as they relate to roads, rails, airports and ports. http://climate.dot.gov/impacts-adaptations/pdf/entire.pdf
US DOT Impact Study The study applied existing predictions of global sea level rise from the Intergovernmental Panel on Climate Change’s (IPCC) Third and Fourth Assessment Reports The study constructed maps based on DEM’s using NOAA data for a MHHW surface and Highest Observed Water Levels (HOWL) to incorporate storm surge for various sea-level rise scenarios
Thank you! Questions? Stephen.gill@noaa.gov 301-7132981 ext 139
Sea Level Change – Two Distinct Attributes • Global Sea Level • The average height of all the Earth's oceans • Caused by the global change in the volume of water in the world‘s oceans in response to three climatological processes: • Ocean mass change associated with long-term forcing of the ice ages • Density changes from total salinity • Heat content of the world‘s ocean, which recent literature suggests may be potentially accelerating due to global warming • Relative Sea Level • The local change in sea level relative to the elevation of the land at a specific point on the coast.
Two primary causes of global sea level rise: Thermal expansion Addition of water volume (glaciers, ice sheets, etc) Global Sea Level The Global Mean Sea Level Trend From Tide Gauges & Altimetry Suggests an Acceleration Satellite altimetry ~2.9 mm/yr 1993-present Church et al., 2006 ~0.7 mm/yr, 1870-1935; then 1.8 mm/yr 1936-2001 mm
Global Sea Level - The Satellite Altimeter Record The overall global rate from multiple missions. Coverage from 60N to 60S from 1993 to present. There is a diversity of regional rates from satellite altimetry that go into the computation of the overall global rate.
Sea Level Rise Trends and Projections IPCC, 2007 IPCC, 2001 • The Intergovernmental Panel on Climate Change (IPCC) 2007 report projects a 18 to 59 cm sea level rise from a 1.1 and 6.4 °C temperature increase during the 21st century (this projection does not consider potential contributions from accelerated ice melt in Greenland and Antarctica). www.ucar.edu