Download
1 / 18
180 likes | 303 Vues
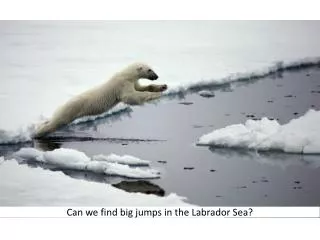
SFB 460. Sea Level Anomalies in the Labrador Sea. Andreas Funk (1) , Peter Brandt (1) , Friedrich Schott (1) , and William J. Emery (2) (1) Leibniz Institute of Marine Sciences, IFM-GEOMAR, Kiel, Germany (2) University of Colorado, Boulder, Colorado. afunk@ifm-geomar.de. Overview.

E N D
SFB 460 Sea Level Anomalies in the Labrador Sea Andreas Funk(1), Peter Brandt(1), Friedrich Schott(1), and William J. Emery(2) (1)Leibniz Institute of Marine Sciences, IFM-GEOMAR, Kiel, Germany (2)University of Colorado, Boulder, Colorado afunk@ifm-geomar.de
Overview • Cyclonic gyre circulation • Northern branch of the MOC • In the Labrador Sea the upper part of the NADW is formed • Generation of LSW has large interannual variability and depends on many factors. Schott et al., 2004
Outline • Altimeter processing • Main modes of SLA variability in the Subpolar North Atlantic • Separate analysis in the Labrador Sea • Discussion • Summary
Altimeter data processing: • Along-track delayed time products from Aviso and PODAAC, with the usual corrections applied, were used. TOPEX/Poseidon, ERS-2, Jason-1, Envisat and Geosat Follow-On data were analyzed. • Monthly maps on a 0.2 x 0.2° grid were produced using Gaussian weight factors. • To find consistent temporal mean SLA fields for the different satellite products the • following corrections are applied: • First 20 EOF calculated from merged TP (old track) and ERS-2 data. • EOF time series recalculated using merged EOF pattern and single satellite data. • Single satellite data corrected by the temporal mean difference between merged • and single satellite data in the overlapping period • First 20 EOFs are recalculated and similar corrections for the temporal mean fields • are applied to Jason-1, TP (new track), Envisat, and GFO.
A separate analysis of the Labrador Sea yields different results. • Distinctive Maximum in the southeastern part • Sharp SLA gradient around the maximum • Northward geostrophic velocity anomaly near 53°N • No long-term trend • Maxima 1995/1996 and 2000/2001 • Distinctive minimum 2003
Comparison of altimetric velocity anomalies with near-surface current meter measurements yields significant correlations. • At both locations a maximum is seen in 2003. • The maximum in 2003 fits well with the minimum in the recirculation cell found in the EOF. • The maximum in 2003 fits well with the maximum in the SPNA wind stress curl.
Current meter measurements of the deep Labrador current at 1500m depth near 53°N and at the AR7W section show an increase from 1997 to 2000 and no significant trend afterwards. Fischer et al. to be submitted to GRL
Mean geostrophic pressure derrived from float trajectories at 700m depth between 1994 and 1999 shows a recirculation cell at the western boundary Lavender et al., 2000
Mean geostrophic pressure derrived from float trajectories at 700m depth between 1994 and 1999 shows a recirculation cell at the western boundary Lavender et al., 2000
Mean geostrophic pressure derrived from float trajectories at 700m depth between 1994 and 1999 shows a recirculation cell at the western boundary Lavender et al., 2000
Brandt et al. subm. to JPO FLAME 1/12° regional model simulations using climatological forcing confirm a doming of isopycnals leading to large rates of (upper) LSW generation between boundary current and recirculation.
AMSR-E passive microwave SSTs show the intrusion of warm water from the south as far north as 55° N.
Possible explanations for the warming along 59° N: Enhanced eddy sheding in winter 2003 of Westgreenland eddies advecting caps of cold and fresh water over a warm and salty core southward?
Possible explanations for the warming along 59° N: Larger heat losses from the ocean to the atmosphere during winter 2003? NCEP
Summary • No long-term decrease of the shallow gyre circulation in the Labrador Sea is observed. • Strong interannual variability is found in the southern boundary current of the Labrador Sea. • The variability pattern in the Labrador Sea is supported by current meter measurements and microwave sea surface temperatures. • A recirculation cell with large interannual variability leads to the intrusion of warm water from the south into the Labrador Sea and confines the area of the winter time cold water patches in the central Labrador Sea.
Publications in preparation • P. Brandt, A. Funk, L. Czeschel, C. Eden, and C. Böning, Ventilation and transformation of Labrador Sea Water and its rapid export in the deep Labrador Current, submitted to JPO. • W. J. Emery, P. Brandt, A. Funk, J. Fandre, and C. Böning, A comparison of sea surface temperatures from microwave remote sensing of the Labrador Sea with in situ measurements and model simulations, submitted to JGR. • A. Funk, P. Brandt, F. Schott, and W. J. Emery, Circulation variability in the Subpolar North Atlantic, to be submitted to GRL. • J. Fischer, F. Schott, M. Dengler, and R. Zantopp, Interannual to decadal variability of the Deep Labrador Current, to be submitted to GRL.