
Uploaded by
jalene
19 SLIDES
450 VUES
200LIKES
Sea Level
DESCRIPTION
Sea Level. Mark Merrifield, Steve Gill, and Gary Mitchum 1. Sea Level Rise 2. 2005 Sea Level 3. Extreme Events.
Download
1 / 19
Download Presentation

Télécharger la présentation
Sea Level
An Image/Link below is provided (as is) to download presentation
Download Policy: Content on the Website is provided to you AS IS for your information and personal use and may not be sold / licensed / shared on other websites without getting consent from its author.
Content is provided to you AS IS for your information and personal use only.
Download presentation by click this link.
While downloading, if for some reason you are not able to download a presentation, the publisher may have deleted the file from their server.
During download, if you can't get a presentation, the file might be deleted by the publisher.
E N D
Presentation Transcript
Sea Level Mark Merrifield, Steve Gill, and Gary Mitchum 1. Sea Level Rise 2. 2005 Sea Level 3. Extreme Events
Figure 5. Time series of TOPEX and Jason differences relative to the global tide gauge network. Note that difference in the values on the vertical axes. The Jason mean is 121 mm relative to TOPEX. The cause of this bias is presently unknown. The TOPEX scatter is 5.3 mm; the Jason scatter is 9.3 mm.
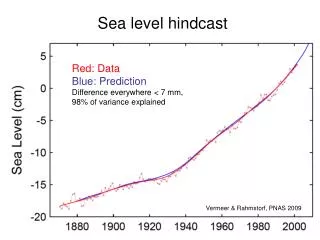
2006 Report Evidence for an Acceleration in Sea Level Trend Decadal Variability


More Related
Audio
Live Player