Global Sea Level Rise
Global Sea Level Rise. Laury Miller NOAA Lab for Satellite Altimetry. Why Measure Sea Level Rise? Inundation Will Have a Catastrophic Impact. Heat Outgoing. Heat Incoming. . . Top of Atmosphere. . Net Heat Input Causes Global Warming. What’s Causing Global Warming?.


Global Sea Level Rise
E N D
Presentation Transcript
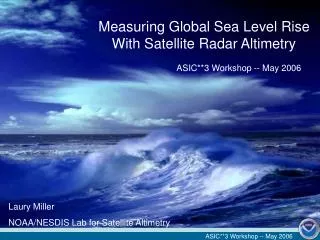
Global Sea Level Rise Laury Miller NOAA Lab for Satellite Altimetry
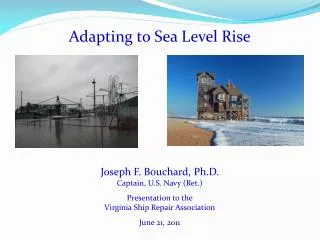
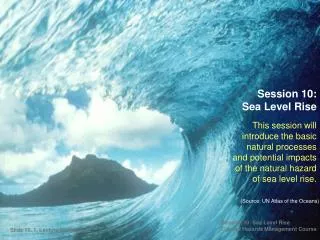
Why Measure Sea Level Rise? Inundation Will Have a Catastrophic Impact
Heat Outgoing Heat Incoming Top of Atmosphere Net Heat Input Causes Global Warming What’s Causing Global Warming?
Where Does the Heat Go? Amount of Heat Absorbed by Parts of Earth Climate System Over Past 40 Years Net Heat Input to Earth System (Levitus et al., GRL, 2004) 84% -- Saved By The Oceans!
Satellite altimetry Holgate and Woodworth, 2004 1.8 +/- 0.3 mm/yr (1960 to 2000) Church et al., 2004, 2006 What is the most obvious consequence?Mean Sea Level Rise, 1870-2000: ~1.7 mm/yr, with an increase in the rate of rise
Sea Level Rise From Topex & Jason-1: 1993-2007 GLOSS Tide Gauges • Sea Level Rise is spatially, highly non-uniform • Tide gauges are important, but primarily for altimeter calibration
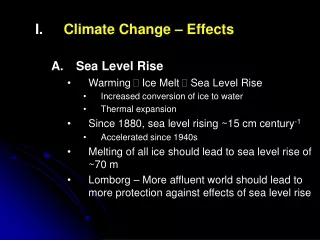
Ice Melt Sea Level Rise Heat More Water, More Mass Thermal Expansion, More Volume What’s Causing Sea Level Rise?
1920 - 1990 1992 - 2003 3.2 mm/yr Sea Level Budget Changes With TimeCurrent Rate Nearly Twice the 20th Century Rate Largely Due to Volume Changes 1.8 mm/yr 1.7 mm/yr 1.5 mm/yr 1.3 mm/yr 0.5 mm/yr Volume Mass Total Volume Mass Total
70 m 6 m Antarctica Greenland Sources of Ice Melt & Potential Impact on Sea Level 0.7 m Mountain Glaciers
Arctic Sea Ice Is Disappearing At Record Rate Summer 1979 Summer 2003 The loss poses grave environmental dangers … but not Sea Level Rise … (Archimedes Principle)
Ice Melt Contributions to Sea Level Rise:Glaciers & Ice Sheets Cryospheric sea-level rise: glaciers and ice sheets Mountain Glaciers Are Currently the Biggest Source, But Probably Not For Long. Konrad Steffen, Steve Nerem,CIRES, Univ. of Colorado
Greenland Is a Growing Worry Its ice sheets are flowing faster towards the ocean during summer. Possibly due to surface melt water cascading down crevases and providing lubrication at the ice/rock interface.
How Is The Ocean Heat Distribution Measured? Argo Profiler Array
Starting in 2000,Argo Attained Global Coverage of the Oceans* in Nov 2007 * ice-free oceans Courtesy of Mathieu Belbeoch, Argo Information Center
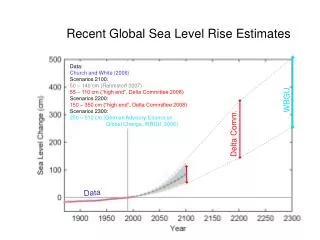
How accurate are the projections?IPCC projects sea level to rise ~30-80 cm by 2100 The additional land-ice uncertainty Model projection Satellite altimetry Reconstructed record from tide gauges Observed sea level is rising at the upper limit of IPCC TAR projection that includes a “land-ice uncertainty” * 4th Assessment Report Rahmstorf et al., Science, 2007
Can We Close the Sea Level Budget? Total Sea Level Volume Sea Level Mass Sea Level Jason = +3.6 mm/yr Argo + GRACE = +0.6 mm/yr ? Argo = -0.5 mm/yr GRACE = +0.8 mm/yr Willis, Chambers & Nerem, JGR, 2008