Download
1 / 21
261 likes | 497 Vues
Global warming and sea level rise. James Carton and Semyon Grodsky University of Maryland. Displaced pole horizontal grid. 900x720x40 = 25M grid points. State Variables: u, v, T, S, …. Time step: 20min (26K ts/yr). http://climate.lanl.gov/Models/POP/. Numerics.

E N D
Global warming and sea level rise James Carton and Semyon Grodsky University of Maryland
Displaced pole horizontal grid 900x720x40 = 25M grid points State Variables: u, v, T, S, … Time step: 20min (26K ts/yr) http://climate.lanl.gov/Models/POP/
Numerics • Arakawa-C grid in horizontal • Upstream advection • Leap frog time differencing • Separate internal and external modes • MPI, shared memory • Output is in netcdf v T,S u u v
Model details • Mixing • KPP, bi-harmonic • Winds • ERA40 daily stress • QuikSCAT • Topography • Sandwell and Smith (etopo30) with McClean modifications for some passages • Freshwater flux • GPCP precipitation when avail., bulk formula evaporation, seasonal river discharge. Relaxation to clim. salinity under ice. • Heat flux • Bulk formula • Sea ice • Observed monthly cover 1979- • Tracers CFCs, …
Assimilation details (I) • Multivariate two-stage sequential updating algorithm • Stage I correct bias • Stage II correct state • Time increment • 10dy IUA {a digital filter}
Global hydrographic observations vs depth Salinity Temperature 16,000 70,000 Depth Depth Change in data coverage
Comparison of observed and analysis sea level at Naha, Japan
SODA Levitus et al 2005
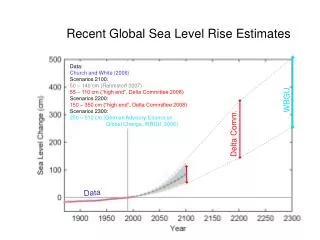
Our estimate of steric sea level rise since 1960 Volcanic Eruptions A EC P
Conclusions • Much of the recent rise seems to be explainable by increases in the thermosteric component • The thermosteric component has substantial decadal variability • Consistent with Church et al. (2005), it seems that the decadal variability, or a significant part anyway, results from changes in net surface radiation induced by volcanic and maybe ENSO effects