Download
1 / 16
170 likes | 453 Vues
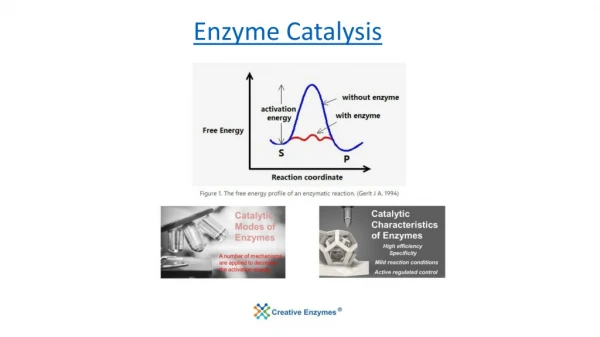
Edvotek kit # 282. Principles of Enzyme Catalysis. Why?. For Biology II or AP biology. Follow up to:. Introduction to. Protein structure & function Properties of enzymes Factors that effect proteins. How do enzymes work/ How is enzyme activity measured?

E N D
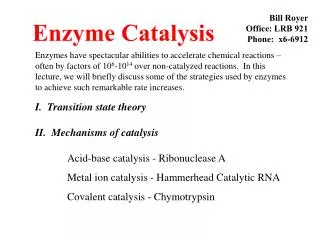
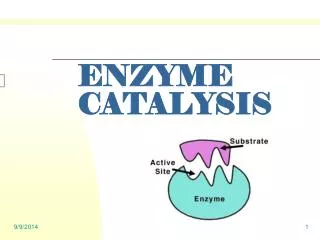
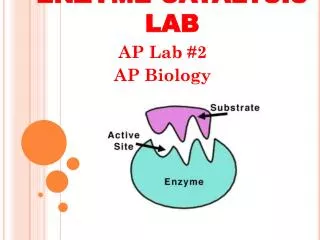
Edvotek kit # 282 Principles of Enzyme Catalysis
For Biology II or AP biology Follow up to: Introduction to • Protein structure & function • Properties of enzymes • Factors that effect proteins • How do enzymes work/ • How is enzyme activity measured? • What is an enzyme assay and why are they important?
What enzymes do • http://rds.yahoo.com/_ylt=A0SO8ZldIzVM2xgAsww8QF;_ylu=X3oDMTA4NDgyNWN0BHNlYwNwcm9m/SIG=11osgf0i9/EXP=1278637277/**http%3a//www.youtube.com/v/VfaTrOxOKkU
A different take http://rds.yahoo.com/_ylt=A0SO8ZldIzVM2xgAsww8QF;_ylu=X3oDMTA4NDgyNWN0BHNlYwNwcm9m/SIG=11osgf0i9/EXP=1278637277/**http%3a//www.youtube.com/v/VfaTrOxOKkU
Measuring Enzyme Activity • Corn shucking analogy – what is measured? • We are the enzymes (my friend) • Corn = substrate • Shucked corn = product • How do we measure how fast we the enzymes work ? • How fast does our substrate/ corn disappear or… • How fast does our shucked corn/product appear
What are factors that effect enzyme activity? • What if room is filled with corn? • What if the room is too cold? Too hot? • What if your fingers were broken? • What if had to wear mittens?
Enzyme Assay • Measuring activity at different temperatures • Measuring activity at different pHs • Measuring activity at different substrate concentrations
This lab • Enzyme being measured – catalase • Reaction being catalyzed • H2O2 --catalase- H2O + ½ O2 • How can we measure substrate used or product made?
We will measure the amount of H2O2 remaining after catalysis by catalase by coupling to a secondary reaction with KI as follows: 2 I- + H+ + H2O22H2O + I2 (colorless) (reddish brown)
Then you will take aliquots out of the reaction tube at 6 different time intervals and mix with an assay solution. The assay solution does two things Stops the action of catalase, so no more H2O2 is broken down Contains the acidic KI that can react with the remaining H2O2 How So?You will catalyze H2O2 with catalase in a reaction tube.
Color change can be measured by a spectrophotometer. • The more hydrogen peroxide present in the aliquot removed, the more iodine is produced in the secondary reaction • The more iodine produced in the secondary reaction, the more reddish brown color produced. • The more reddish brown color produced, the greater the Absorbance reading (A) on the spectrophotometer.
Thus, • Absorbance corresponds to H2O2 concentration • Therefore, as the catalase reaction proceeds, more H2O2 is consumed, so overtime, Absorbance readings should decrease.
Divide into four groups Materials for each group Shared materials - 6mL reaction cocktail (buffered H2O2) • 25mL Assay solution (contains acidic KI & chemicals to inactivate catalase) • 1 mL catalase on ice • 1 mL phosphate buffer • 10 15mL tubes • 1000uL micropipet & tips • 2 5mL disposable pipets & bulbs • Tray for spectrophotometer • spectrophotometer
Procedure Prepare tubes as directed p. 10-12 labeled as follows For spectrophotometer readings • Con (control) • RXN (reaction) • B (Blank for spec) • 0 • 0.5 • 1.0 • 1.5 • 2.0 • 2.5 • 3.0 • Load 300uL from each of your ten tubes into the proper labeled well of the spectrophotometer tray. • Each group’s wells will be read at the same time • Record your Absorbance readings in chart on p. 12 • Plot absorbance vs time on graph on page 16
How should the graph look? • How would the graph be different if the reaction was done at 5oC? • How would the graph be different if the reaction was done at 37oC? • How would the graph be different at ph 4?