Download
1 / 20
200 likes | 312 Vues
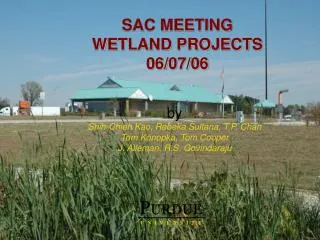
SAC MEETING WETLAND PROJECTS 06/07/06. by Shih-Chieh Kao, Rebeka Sultana, T.P. Chan Tom Konopka, Tom Cooper J. Alleman, R.S. Govindaraju. P URDUE U N I V E R S I T Y. Test site. Near city of Greenfield due east of Indianapolis on I-70. Greenfield Wetland System Schematic. Effluent.

E N D
SAC MEETING WETLAND PROJECTS 06/07/06 by Shih-Chieh Kao, Rebeka Sultana, T.P. Chan Tom Konopka, Tom Cooper J. Alleman, R.S. Govindaraju PURDUE UNIVERSITY
Test site Near city of Greenfield due east of Indianapolis on I-70.
Greenfield Wetland System Schematic Effluent LS-4 M-4 ST-1 ST-2 (To city) AS-2 LS-1 F-1 AS-1 M-1 AS-4 LS-3 F-3 ACT-1 M-3 W-3 Wetland Cell (W-1) Wetland Cell (W-2) Recirculation Biofield ACT-2 LS-2 LS-2 M-2 F-2 FS N Not to scale AS-3 Weather station Lift station/Dosing Chamber V notch weir Flow meter Flume Flow meter Automatic Sampling Station Magnetic Flow meter Flow splitter
Wetland Performance Table: Wetland performance
WETLAND DATA AVAILABILITY Credit : Shih-Chieh Kao, PhD Candidate
Data Analysis Oct 22nd to Nov 22nd, 2004 September, 2004 June, 2004
Data Analysis (Contd…) October, 2004
Data Analysis (Contd…) Last 10 days in April,2004 Last 10 days in April,2004 Last 10 days in April,2004
Data Analysis (Contd…) Last 20 days in November, 2005 Last 10 days in Oct, 2004
Hydraulic flow model Recirculation W-1 83% M-1 LS-1 F-1 ST-2 ACT LS-2 Rain W-2 M-2 17% Biofield F-2 LS-3 ?% W-3 M-3 F-3 ?% M-4 LS-4 Greenfield city
Model Inputs November 1 to 10, 2004
Model Results (contd…) Volumetric efficiency:
Model Validation Input Data: October 22nd to October 31st, 2004
Model Validation (Contd…) Output from F-2 Output from F-3
Model Validation (Contd…) Output from M-1 Output from M-2
Model Validation (Contd…) Output from M-3 Output from M-4
Items for Discussion • SCADA • Data since January 2006-who has it? How can we access it? • Training schedule & website access • Surge tank control of flow rates • PLANTS • Clyde Mason recently did some replanting… • INSTRUMENTS • Gaps in data because of equipment failure, data logger unplugged during constructions, etc. • Inherent measurement problems with instruments • Recycle pumps not working (May 22, 2006) • BIOFIELD • No samples available, except for once in the deepest well • Supply to biofield should be shut off. • DATA AVAILABILITY • Should raw data be put on website? • Or this presentation enough detail. • REPORTS • Under preparation • Any suggestions? • Will seek feedback • OTHER ?