Published by AAAS
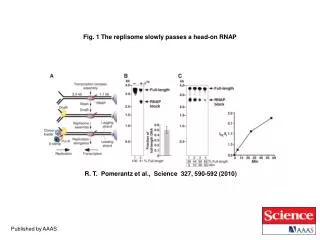
Fig. 1. During the Archean, oceans. A. D. Anbar et al., Science 297, 1137 -1142 (2002). Published by AAAS. Basic Premises/Hypothesis. In the first ca. 2.5 Ga of Earth’s history, nature invested heavily in R&D from which a “core” set of metabolic machines that evolved.

Published by AAAS
E N D
Presentation Transcript
Fig. 1. During the Archean, oceans A. D. Anbar et al., Science 297, 1137 -1142 (2002) Published by AAAS
Basic Premises/Hypothesis In the first ca. 2.5 Ga of Earth’s history, nature invested heavily in R&D from which a “core” set of metabolic machines that evolved. There are approximately 1500 core metabolic genes that make the world go around This period of “metabolic innovation” is characterized by machinery that has been retained virtually without change to the present time (“frozen metabolic accidents”). All of the key metabolic processes were developed in prokaryotes
5. These metabolic sequences are coupled on local and planetary scales to facilitate an electron market between C, N, O, and S. 6. Most of the metabolic sequences were rapidly appropriated by a large number of groups of microbes – and some (not all) subsequently were subsumed into eukaryotic lineages via primary and secondary symbioses. 7. The eukaryotes derived secondary metabolic adapations during the 2nd half of Earth’s history – the era of “metabolic adaptation”, but did not invent any new fundamental process.
8. However, the dispersal of the core metabolic processes to large numbers of widely differing taxa helped to ensure their continuity (resiliance). • 9. All these metabolic sequences are observable in the modern world – but many are extremely “inefficient”. • 10. Despite these inefficiencies, alternatives have not been selected. Why not?
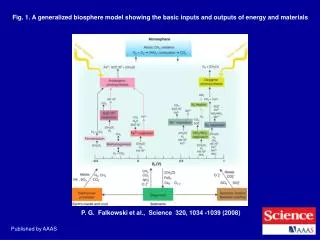
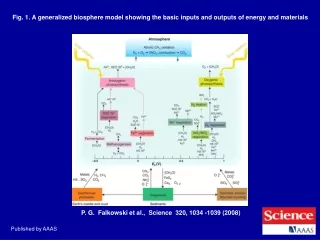
O2-mediated Mn -mediated Fe-mediated S-mediated N-mediated H2 or C-mediated Mn2+ NH4+ Fe2+ HS- CH4 H2 [CH2O] Respiration O2 Mn4+ NO3- N2 Fe3+ SO42- CO2 H2O N2-fixation +CO2 Photosynthesis Falkowski, Fenchel and Delong, Science, 2008
Three examples of frozen metabolic accidents Carbon fixation (C)- Rubisco Nitrogen fixation (N) - Nitrogenase Oxygen evolution (O)- The reaction center of Photosystem II
Rubisco arose from a methionine “salavge” pathway long before it was appropriated for use in the Calvin-Benson cycle. • The enzyme is catalytically challenged, and can barely figure out what its substrate looks like (blind and slow). • In an oxygen rich world Rubisco is notoriously inefficient (dumb). • However, there is very little selection pressure on Rubisco active sites. Why not?
Remove the selection pressure • Cells can make a lot of Rubisco – but don’t reinvent the technology (hire lots of dumb, blind, slow workers), or • They developed a secondary set of adaptations that removed or reduce the selection pressure – e.g., the Carbon Concentrating Mechanism
Example 2: Nitrogenase • A detour into the rise of oxygen the coupling between C,N and O cycles on Earth • 2N2 + 4H+ + 3CH2O 4NH4+ + 3CO2 • A 6 electron transfer reaction
1G20 -- Nitrogenase MoFe protein only Fe8S7 Fe7MoS9 Fe8S7 Fe7MoS9
Digression • Evolution of core structural motifs • The paradox of structure/sequence divergence
Science. 1966 Apr 15;152(3720):363‐366. • Evolution of the Structure of Ferredoxin Based on Living Relics of Primitive Amino Acid Sequences. • Eck RV, Dayhoff MO. • The structure of present‐day ferredoxin, with its simple, inorganic active site and its functions basic to photon‐energy utilization, suggests the incorporation of its prototype into metabolism very early during biochemical evolution, even before complex proteins and the complete modern genetic code existed. Ferredoxin has evolved by doubling a shorter protein, which may have contained only eight of the simplest amino acids. This shorter ancestor in turn developed from a repeating sequence of the amino acids alanine, aspartic acid or proline, serine, and glycine. We explain the persistence of living relics of this primordial structure by invoking a conservative principle in evolutionary biochemistry: The processes of natural selection severely inhibit any change a well‐adapted system on which several other essential components depend.
1FXR – Ferredoxin I from Desulfovibrio Africanus • Ferredoxin protein with Fe4S4 cluster Image Courtesy: Dr. Vikas Nanda (UMDNJ)
1FXR – Ferredoxin I from Desulfovibrio africanus • Fe4-S4 cluster in ferredoxin tightly held by four cystein groups via thiolate bonds
Beta carbon distribution (385 structures) 385 Structures from Protein Data Bank
HiPIP and Fe Nitrogenase • N Fe Nitrogenase HPiP Number of Cysteine peaks…. Signature of different environment for different redox potential?
High potential protein vs Fe protein of Nitrogenase (cont’d) Fe Nitrogenase HPiP Signature of different environment for different redox potential? -number of CYS peaks -Hydrophilic group contrast
The basic FeS binding • ~ 30% of all FeS clusters are bound to a C XX C XX(X) C motif with a final C in a variable position further along the protein. The most common X residues are neutral aa’s (especially A, L and I). These motifs are virtually all chiral!
Example 3: The oxygen evolving complex and the evolution of Photosystem II
Example 3: The oxygen evolving complex and the evolution of Photosystem II
All oxygenic photosythetic organisms share common centers. • The protein, D1, in photosystem II was inherited from purple sulfur bacteria. • In all oxygenic organisms this protein is damaged and replaced (not simply repaired) every 30 min during the day. • Despite this inefficiency, there is almost no change in the primary sequence of this protein for the past 3 Ga (86% identity at the aa level) • Lesson learned: If it works, keep using the old technology. Just pay the costs and fix the machinery.
Why doesn’t this core metabolic machinery improve with age? Hypothesis: The core metabolic machines are usually multimeric protein complexes that bind prostetic groups. The tempo of evolution of the core complexes is constrained by protein-protein interactions. The “Rubic cube paradox” – Don’t mess with it unless you know how to get the thing back to the original configuration.
A C cox pet psb pet chl B A C C D B D L N C D B A C N B L C A B D F D C K J D B B A C A C pet crt cox chl pet cox pet B D D C N L pet psb chl C A B N L B D C A B D C A B A C B D L B N pet pet cox chl pet crt chl pet cox D B C A B A C D C A B D N B L B crt pet psa psb pet chl cox D C psb Photosynthetic gene clusters in cyanobacteria 1 kb Synechocystis sp. PCC6803 EFLJ D F E G I A A B D B C K J psb ndh ndh psa ndh crt Anabaena sp. PCC7120 EFLJ A I G E D B F D A B J K C ndh ndh psb psa ndh crt Thermosynechococcus elongatus BP-1 EFLJ A B B A I G E D F D psa ndh psb ndh crt Synechococcus sp. WH8102 JLFE E G I A B A ndh ndh psb ndh psb psa Prochlorococcus marinus MED4 EFLJ E G I A F D B A J K C D C ndh ndh psa ndh psb psb Prochlorococcus marinus MIT9313 EFLJ J K C F D E G I A ndh ndh psb ndh
C6H12O6 Phycobilisome L S 4H+ Rubisco NADPH NADP + H+ e− FNR PE α β PC CF1 Fd AP b' FA|FB e− γ NADH NAD++H+ Fx ε δ 2H+ 2H+ 2H+ PS II b6f Cyt co PS I PQ ndh QB A1 e− ci A QA bH C D A0 A B b CP47 CP43 a bL Phe IV b6 A C B B P700 D2 D1 e− e− CF0 P680 PQH2 PQH2 PC e− or YZ O2+2H+ H2O H+ Cyt c553 f ISP f e− O e− PC P' V or 2H+ Cyt c553 O2+2H+ H2O Photosystem II NADH dehydrogenase Cytoxhrome b6f complex Cytoxhrome oxidase Photosystem I ATP synthase Protein-protein interactions in linked photosystems revealed by the co-evolutionary analysis. Red lines represent predicted interactions with coefficient values better than 0.8. Also shown is a network of protein-protein interactions in the ATPase complex. The pattern of protein-protein interactions strongly suggests co-evolution of photosynthetic genes driven by electron transport and redox state of the primary photochemistry. Black arrows, electron transfer; blue arrows, proton transfer.
So how can such apparently inefficient machinery be both robust and resilient? • Spread the risk (The “Microsoft” approach) • Select secondary adaptive features
Euglenophyta Euglena Chlorophyta Bacillariophyta Odontella Chlorella psbM petA petD petL psaI rne rpl19 rpoA cysA cysT ftsW infA minD ndhA-I ndhK accD ccsA cemA chlB chlL chlN clpP Nephroselmis ftsW ndhA-I ndhK Cryptophyta Guillardia cemA cpeB ftrB ilvB ilvH infB minD pbsA psaK rne tsf psaM Rhodophyta Mesostigma Porphyra rpl22 thiG bas1 Cyanidium accD bas1 cpeB infB minD pbsA psbX rps20 Secondary endosymbiosis hisH minD ndhJ odpB rpl33 rps15 rps16 Streptophyta Glauco- cystophyta Cyanophora chlN cpcA cpcB cpcG dfr glnB gltB hisH infC nblA accA accB accD apcA apcB apcD apcE apcF argB carA ntcA odpA odpB petJ preA rpl28 trpA trpG trxA Marchantia rps16 rpl21 cysA, cysT rpl21, ndhA-K pgmA rpl9 rps1 syfB syh upp chlB chlL cpeA dsbD fabH fdx moeB Pinus cysA, cysT, rpl21 chlB,L,N, psaM atpI cemA minD odpB rne rpl23 rpl32 Nicotiana accD acpP apcA apcB apcD apcE apcF atpD atpG cpcA cpcB dnaK groEL hisH petF petM preA psaE psaF psbV psbW psbX rbcR rpl1 rpl3 rpl6 rpl11 rpl18 rpl28 rpl34 rpl35 rps5 rps6 rps10 rps13 rps17 rps20 secY trpG Oryza chlI ftsW minD odpB rne rpl5 rpl12 rpl19 rps9 tufA Zea clpP ftsW psbM rbcLg Secondary endosymbiosis glnB gltB ilvB ilvH infB infC moeB nblA ntcA odpA pbsA petJ pgmA psaD psaK psaL rbcLr rbcSr rpl4 rpl9 rpl13 rpl24 rpl27 rpl29 rpl31 rps1 secA syfB syh thiG trpA trxA tsf upp cystA cystT infA ndhA-K rps15 accA accB argB bas1 carA clpC cpcG cpeA cpeB dnaB dfr dsbD fabH fdx ftrB ftsH bioY crtE groES hemA mntA mntB nadA rbcSg > 90% of genes lost Primary endosymbiosis Ancestral photosynthetic prokaryote
How does this inform us about N limitation in the ocean or other aquatic ecosystems? Reflection of elemental N/P ratios from organic matter in the soluble inorganic pool of fixed N and P. Is the Redfield “paradigm” for the ocean a coincidence or a true biological feedback?
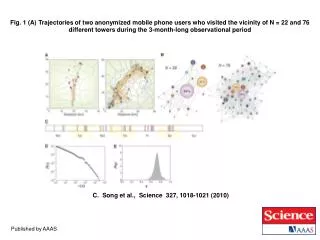
Variations in N:P Analyzed deep water DIN, DIP, and O2 measurements from 104 observational data sets for 33 water bodies Water bodies ranged from ocean basins to freshwater lakes, from 109 km2 to 0.075 km2 Seawater N:P averages 15-16 Freshwater N:P range from 0.005 (Lake Lugano (Barbieri and Simona, 2001)) to 8700 (Lake Superior (Sterner et al., 2007)). Restricted basin N:P range from ~20 (Med and Red Seas) to 1 (Caspian (Sapozhnikov et al., 2007))
Distribution of N:P Data Canonical Redfield ratio is anomalous
N:P vs. O2 N:P linearly correlated to O2 when O2 is < 100M Loss of N linked to denitrification under low O2