Download
1 / 37
370 likes | 518 Vues
Exploiting Temporal Dependency for Opportunistic Forwarding in Urban Vehicular Network. Hongzi Zhu, Sherman Shen, Sagar Naik, Shan Chang and Minglu Li. [MANET-2] Presented by Cui Kai 2011/5/25. Outline. Reasons to propose this algorithm Empirical vehicular data analysis

E N D
Exploiting Temporal Dependency for Opportunistic Forwarding in Urban Vehicular Network Hongzi Zhu, Sherman Shen, Sagar Naik, Shan Chang and Minglu Li [MANET-2] Presented by Cui Kai 2011/5/25
Outline • Reasons to propose this algorithm • Empirical vehicular data analysis • Analyzing ICT temporal patterns • Opportunistic forwarding algorithm • Performance evaluation • Conclusion
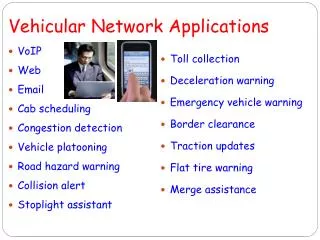
Introduction • Goal • to provide safety and comfort applications to drivers and passengers Through vehicles equipped with wireless communication devices and roadside infrastructure Main challenge Data transfer
Data Transfer Usually in a strore-carry-forward fashion Key factor vehicular mobility characteristics (e.g. how often such contact opportunities take place and on how long they last) ICT (Inter-Contact Time) The delay between two consecutive contacts of the two vehicles
Related Researches • Some works Ideally assume that the future node movement is known in advance • In reality the information of future movement is unavailable However, when node mobility is not completely random, it is possible to make forwarding decision based on mobility history • Requiring no connection history • Random walk----moderate network traffic BUT large end-to-end delay • Epidemic routing----minimum end-to-end delay BUT unacceptable network overhead
Related Researches Drawbacks of The Recent Kindred Research • Mainly focus on the distribution of ICTs • it is not clear how to design a practical algorithm utilizing the characteristics of ICTs
Related Researches In this paper • Data-driven approach in designing and evaluating our opportunistic forwarding algorithm • Extensive GPS trace data collected from more than ten thousand public vehicles (taxies and buses) in Shanghai and Shenzhen • Analyze more than 45 million pairwise contacts resolved from the trace to characterize the contact interaction among vehicles What is found ?
Outline • Reasons to propose this algorithm • Empirical vehicular data analysis • Analyzing ICT temporal patterns • Opportunistic forwarding algorithm • Performance evaluation • Conclusion
Data Analysis Data Source • three sets of GPS traces of more than 10 thousands of public vehicles in Shanghai and Shenzhen • Including Shanghai Bus, Shanghai Taxi and Shenzhen Taxi • Periodically send report back to a datacenter at a granularity of around one minute
Statistics of Inter-Contact Time • 1. Extraction of Inter-Contact Time from Trace Data • Using a sliding time window of 1 minute and a communication range of 100 meters, and assume that two vehicles would have a connection opportunity (called a contact) if their locations reported within a given time window are within the communication range. • Inter-Contact Time Distribution Characteristics • plot the tail distribution (CCDF) of ICTs over time • as figure. Conclusion This implies vehicles frequently meet each other in urban settings.
Statistics of Inter-Contact Time Examine the probability density function (PDF) of inter-contact time Conclusion This indicates that if a vehicle meets another vehicle at certain time the probability that the two vehicles meet again at the same time in the following days is very high.
Outline • Reasons to propose this algorithm • Empirical vehicular data analysis • Analyzing ICT temporal patterns • Opportunistic forwarding algorithm • Performance evaluation • Conclusion
Analyzing ICT temporal patterns • How historical inter-contact time information is related to the current inter-contact time • how inter-contact time patterns evolve over time and how much historical information we need to track to capture the inter-contact time patterns over time • Characterizing temporal correlations of successive ICTs • Evaluation of the ICT patterns
Characterizing temporal correlations of successive ICTs • Examine the correlation between inter-contact times by • the marginal entropy of inter-contact times between each pair of vehicles • the conditional entropy of the inter-contact times between a pair of vehicles given their previous M inter-contact times in all of the three data sets Though an inter-contact time can be infinitely long in time, as it can be seen from the right figure that most inter-contact times are less than a relatively short period of time 90%
Characterizing temporal correlations of successive ICTs Therefore, an inter-contact time can be specialized into a discrete finite value space as,
Characterizing temporal correlations of successive ICTs Conclusion that the uncertainty about the inter-contact time decreases when knowing the previous inter-contact times between the same pair of taxies.
Characterizing temporal correlations of successive ICTs • The other two data sets SZ taxi SH taxi Interestingly, taxies in Shenzhen also have much smaller conditional entropy than taxies in Shanghai. This suggests that taxies in Shanghai operate more randomly with less interference of drivers than taxies in Shenzhen.
Evaluation of the ICT patterns • Use Redundancyto quantify the correlation Divide time into time slot of 4 hours Figure.7 show the two weeks’ results This should reflect the different shift rules of taxies in SZ and SH
Evaluation of the ICT patterns Aggregated history information It is clear that the redundancy increases until n(day) reaches to about three weeks. This implies that information older than three weeks does not help in capturing ICT temporal patterns.
Outline • Reasons to propose this algorithm • Empirical vehicular data analysis • Analyzing ICT temporal patterns • Opportunistic forwarding algorithm • Performance evaluation • Conclusion
Opportunistic forwarding algorithm • The analysis above shows we can predict when the next connection opportunity between a pair of vehicles will probably occur based on their recent inter-contact times. First capture the inter-contact time temporal patterns between each pair of vehicles using higher order Markov chain models. Then, we describe our opportunistic forwarding strategy and discuss the algorithm parameter configuration in terms of system performance and memory cost.
Markov Chain Model of K-th Order • In a finite-state Markov process, the current state of the process depends only on a certain number of previous values of the process. We use a k-th order Markov chain to represent the temporal dependency of ICT between a pair of vehicles Once the Markov Chain Model is involved, the maximum estimators of the state transition probabilities of the k-th Markov chain are
Opportunistic Forwarding Strategy • In order to acquire the knowledge of inter-contact patterns, a vehicle first collects recent inter-contact times between itself and all other vehicles. • Meantime, it establishes a k-th order Markov chain for each interested vehicle in the network by determining the state transition probabilities. • As a new inter-contact time comes, the vehicle also updates the corresponding Markov chain. • It then uses the established Markov chain model as guidance to conduct future message forwarding. • e.g. When a vehicle v1 encounters vehicle v2, v1 will act as the next relay for this message if one of the two following cases happens: • v1 is the destination of the message • v1 is a better candidate for relaying this message if the estimated delay of the next contact between v1 and v[des.] is shorter than that between v2 and v[des.] • After transmitting this message to v1, v2 simply removes this message from its buffer
Algorithm Parameter Configuration • There are FOUR key parameters that are essential to the performance • Maximum inter-contact time • The counting measure • The order of Markov chain model • The length for learning stage There is a tradeoff between memory cost and system performance. • Given , a small counting measure will increase the number of states in the Markov chain models, preserving more detailed information at a price of larger memory consumption • While increasing the length of learning stage will definitely help improving the accuracy of estimation for next connection • On the other hand, if equals , there is only two states in the Markov chain.
Algorithm Parameter Configuration • Figure shows an example of the average number of state transition probabilities per pair of vehicles in Shanghai taxi data set It can be seen that the number of state transition probabilities reaches the maximum when takes the minimum value, and k=6
Outline • Reasons to propose this algorithm • Empirical vehicular data analysis • Analyzing ICT temporal patterns • Opportunistic forwarding algorithm • Performance evaluation • Conclusion
Methodology • Compare our algorithm with following alternative schemes: • Epidemic • Vehicles exchange every packet whenever they have a contact • Requires large buffer size • Generates a tremendously large volume of network traffic (bad for wireless) • Minimum Expected Delay (MED) • Utilizes the expected delay metric to guide data forwarding • Used to estimate the expected delay based on real contact records • Maximum Delivery Probability (MDP) • Utilize the delivery probability metric to guide data forwarding • Delivery probability reflects the contact frequency
Methodology • We consider THREE important metrics to evaluate the performance of our algorithm and the above schemes: • Delivery ratio • End-to end delay • Network traffic per packet In the following simulations, we randomly choose 500 vehicles from the three data sets. And at the beginning of each experiment, we inject 100 packets. And for each packet the source and destination are randomly chosen. P.S. Here we make an assumption that contacts are always successful
Effect of Algorithm Parameters • The maximum inter-contact time is set to be the period of time of 6 days. • Counting measure varies from 4 hours to 6 days • Markov chain k varies from 1 to 20 • For each value of and k, run the ex. 50 times Minimum delay-- =4h, k=6
Effect of Algorithm Parameters • Fig. 11 shows the delivery ratio as a function of and k : The results of the other two data sets are similar: best system performance come from the smallest with k=5 for SH bus and k=6 for SZ taxi
Effect of Learning Stage • In this simulation scenario, we examine how much history information is essential for setting up our models. Set a small and the corresponding optional k, and gradually increase the time for learning 53.62 22.87 The MED and the MDP schemes achieve the minimum end-to-end delay of 61.62 hours and 61.02 hours, respectively, using one day for learning. The epidemic scheme has the minimum end-to-end delay of 8.6 hours.
Effect of Learning Stage • plot the delivery ratio as a function of learning time in Fig. 13 (omit the epidemic scheme) The Markov scheme can reach to a 96% delivery ratio when the length of learning stage is larger than three weeks. The Markov scheme can delivery about 84% more packets, compared with the best performance of the MDP and the MED schemes
Effect of Learning Stage • Fig. 14 shows the average network traffic per packet generated in the network. It takes three more hops on average to deliver a packet using the Markov scheme than using the MED and the MDP schemes to achieve best performance. The Epidemic scheme has a cost of 1.87*10^5
Effect of Multiple Paths • Consider TWO multiple path forwarding strategies: • Better candidate • Ever-best candidate It can be seen that the proposed scheme can achieve appealing delivery performance (22.87-hour end-to-end delay and 96% delivery ratio) even with one-path forwarding.
Outline • Reasons to propose this algorithm • Empirical vehicular data analysis • Analyzing ICT temporal patterns • Opportunistic forwarding algorithm • Performance evaluation • Conclusion
Summary & Future Work What’s DONE • we have demonstrated that urban vehicles show strong temporal dependency in terms of how they meet each other. • The studied data sets are very representative with respect to mobility characteristics in urban settings. • we have developed an appealing opportunistic forwarding algorithm using higher order Markov chains • our scheme can achieve comparable delivery performance as the epidemic scheme with a conservative network cost. What’s TO BE done • More investigation on the end-to-end delay with limited wireless bandwidth • Validate our algorithm by field tests and collect more types of vehicles