Download
1 / 59
590 likes | 734 Vues
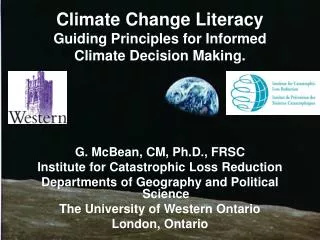
Climate Change Literacy Guiding Principles for Informed Climate Decision Making. G. McBean, CM, Ph.D., FRSC Institute for Catastrophic Loss Reduction Departments of Geography and Political Science The University of Western Ontario London, Ontario. 1. The Climate System.

E N D
Climate Change LiteracyGuiding Principles for Informed Climate Decision Making. G. McBean, CM, Ph.D., FRSC Institute for Catastrophic Loss Reduction Departments of Geography and Political Science The University of Western Ontario London, Ontario 1
The Climate System The Sun is the primary source of energy • Interacting components: atmosphere, ocean, land surface, sea ice, glaciers… • Processes are complicated and all components are interconnected Life on Earth depends on, is shaped by, and now affects climate.
Climate Change Literacy The Essential Principles of Climate Science The Greenhouse Effect 3
Land life Ozone layer Humans Oxygen Intervention Oceans – marine life Greenhouse effect Some water condenses to liquid – clouds-rain Gases came out – water vapour As the planet cooled from its very hot beginning
GREENHOUSE EFFECT – gases in atmosphere trap energy and warm the surface and lower atmosphere 5700oC Short Waves ~10% ~25% Long Waves 15oC ~65%
Atmosphere: mass 90x earth’s GH Gases: >90% CO2 Sfc. Temp.: 477C GH Effect: 523C FAR TOO HOT! Venus • GH Gases: ~0.04% CO2 • ~ 1% H2O • Sfc. Temp.: 15C • GH Effect: 33C • NOT BAD! Earth Atmosphere: mass <1% earth’s GH Gases: >80% CO2 Sfc. Temp.: -47C GH Effect: 10C FAR TOO COLD! Mars Other planets also have Greenhouse Effects, but these are unsuitable for life Sun
Time Scales for Climate System regional issue) • Water cycle 10 days • Ocean response years to centuries • Emissions to globe years • Methane gas 10 years • Carbon dioxide 100 years • End-use technologies years • Supply technologies decades • Social standards decades global issues responding
Climate change is a long-term issue Issues of intergenerational and international equity 8
Intergovernmental Panel on Climate Change (IPCC) – assess climate change – 1990,95, 2001,07 Most scientific information in this presentation is from IPCC (or Canadian national assessments) Nobel Peace Prize for 2007: awarded to: Intergovernmental Panel on Climate Change (IPCC) and Albert Arnold (Al) Gore Jr. The Norwegian Nobel Committee noted that it “is seeking to contribute to a sharper focus on the processes and decisions that appear to be necessary to protect the world’s future climate, and thereby to reduce the threat to the security of mankind. Action is necessary now, before climate change moves beyond man’s control.” 9
240 Canadian climate scientists shared in this Prize as co-authors of the one or more of the IPCC major reports. • Lester Pearson won the Peace Prize in 1957.
Changing Greenhouse Gas Concentrationsfrom ice cores and modern data Now 1957 Carbon dioxide Methane Last 10,000 y Nitrous oxide 11
Time Scales for Climate System regional issue) • Water cycle 10 days • Ocean response years to centuries • Emissions to globe years • Methane gas 10 years • Carbon dioxide 100 years • End-use technologies years • Supply technologies decades • Social standards decades global issues responding
Climate change is a long-term issue Issues of intergenerational and international equity 13
Intergovernmental Panel on Climate Change (IPCC) – assess climate change – 1990,95, 2001,07 Most scientific information in this presentation is from IPCC (or Canadian national assessments) Nobel Peace Prize for 2007: awarded to: Intergovernmental Panel on Climate Change (IPCC) and Albert Arnold (Al) Gore Jr. The Norwegian Nobel Committee noted that it “is seeking to contribute to a sharper focus on the processes and decisions that appear to be necessary to protect the world’s future climate, and thereby to reduce the threat to the security of mankind. Action is necessary now, before climate change moves beyond man’s control.” 14
240 Canadian climate scientists shared in this Prize as co-authors of the one or more of the IPCC major reports. • Lester Pearson won the Peace Prize in 1957.
Changing Greenhouse Gas Concentrationsfrom ice cores and modern data Now 1957 Carbon dioxide Methane Last 10,000 y Nitrous oxide 16
Climate Change Literacy Is the Climate Changing? 17
NASA-GISS analysis. 2005 was warmest 2007 and 1998 were second warmest 2008 was 9th warmest in the instrumental period (since 1850) 0.18 0.13 Warming of the climate system is unequivocal, as is now evident from observations of increases in global average air and ocean temperatures, widespread melting of snow and ice, and rising global average sea level. Eleven of the last twelve years (1995 -2006) rank among the 12 warmest years in the instrumental record of global surface temperature (since 1850). 18
Sea-ice is Melting Millions of square km 2008 Year 2007
Climate Change Literacy Why is it changing? 20
Observations Climate Models • Natural processes • Variations in Earth’s orbit? • Variations in Sun? • Volcanoes? Why is the climate changing?
Observations Climate Models • Natural processes • + • Human Processes • Greenhouse gas emissions • Aerosols • Land-cover change
Observations Climate Models Most of the observed increase in global average temperatures since the mid-20th century is very likelydue to the observed increase in anthropogenic greenhouse gas concentrations. Natural processes Natural processes + Human Processes
Climate Change Literacy How will it change in the future? 24
Projecting the Future Emissions GtCO2 eq/yr warming °C per decade Science Uncertainty 3.6C 2.8C 1.8C 0.2 0.18 0.13 And the warming will continue for centuries to follow
Key Messages • The climate has warmed, will continue to warm, and humans are the cause • Mitigation (emission reductions) will not substantially affect the climate over the next few decades – so we have to adapt. • But, choices made now will have a big impact on the second-half of the 21st century climate and beyond.
Climate Change Literacy Adapt to what? 27
No one lives at the global average Medium (A1B) scenario (2090-2099): Global mean warming 2.8oC JJA Annual DJF Much warmer winters; Increased precipitation Hotter summers; Rain - varies Water-sewage, agriculture Forestry, floods, droughts Changing Precipitation 28
In Europe - Record setting August 2003 (more than 35,000 deaths) will be every second summer – by mid-century *A hot day is defined as a day with a maximum temperature above 30C • Actions: • Better design our structures and cities • more green space-shade-use of passive cooling • Heat alerts and responses – medical advice • Cleaner air 37 68 8 22 Projected More frequent hot days – virtually certain Warm spells – very likely Observed Canadian Centre for Climate Modelling and Analysis Centre canadien de la modélisation et de l’analyse climatique
No Breathing RoomNational Illness Costs of Air Pollution Canadian Medical Association (CMA) August 2008 1. In 2008, 21,000 Canadians will die from the effects of air pollution. 2. By 2031, almost 90,000 people will have died from the acute effects of air pollution. The number of deaths due to long-term exposure to air pollution will be 710,000. … 10. 11. In 2008, economic costs of air pollution will top $8 billion. By 2031, these costs will have accumulated to over $250 billion. The processes that result in air pollution are much the same as those that produce greenhouse gases. And more hot days will result in more smog days – for the same emissions
Projections - intense rainfall events, heat waves and smog episodes are likely to become more frequent. • Heat-related mortality could more than double in southern and central Ontario by the 2050s, while air pollution mortality could increase about 15 to 25% during the same interval. • The health of Ontario residents has been at risk … extreme weather, heat waves, smog episodes and ecological changes that support the spread of vector-borne diseases. • Walkerton, Ontario From Impacts to Adaptation: Canada in a Changing Climate 2007
$500M for the August 19, 2005 wind, rain event 32
Historical occurrences of urban flooding 1980, 1996, 2002, 2004 1 in 100 year event in 2002
Severe StormLoss of Service Sept. 29, 2005 93,000 Nov. 6, 2005 120,000 Nov. 16, 2005 50,000 Feb. 4, 2006 100,000 July 17, 2006 170,000 Aug. 2, 2006 150,000 Sept. 24+27, 2006 93,000 Wind Damage to Infrastructure More heavy precipitation events – very likely The Insurance Research Lab for Better Homes
Increased risk of drought Is Likely Boreal forest under stress Climate moves north faster than the trees Natural ecosystems depend on temperature and Precipitation. 550 ppm – mid-late this century Today
Warmer temperatures 184 175 183.5 X X 177 174 X 75.5 183 X X 173 176 74.5 X 182.5 Lake Superior 172 175 73.5 X X Lake Erie 174 72.5 Lakes Michigan-Huron Lake Ontario 1 metre drop in lake level possible Great Lakes Water Levels Current & Projected Ranges Warmer lakes and changing climate resulting in more invasive species in lakes and ecosystems How will this change our access to water, sewage disposal, shipping and recreation? X Average, 1918-1998 X Projected for 2XCO2, assuming no change in natural variability (CCC GCMII from Morstch & Quinn, 1996)
Climate Change is a Global Issue: Coastal vulnerabilities in light of global change • Sea level rise • Increasing settlement in coastal zones Time series of global mean sea level, as a deviation from 1980-99 mean.
Increasing urban settlement in low-lying coastal areas • IPCC has identified Asian mega deltas as “hot spots of vulnerability” • By 2070, nine of the top 10 cities in terms of population exposure will be found in Asia (Kolkata, Mumbai, Dhaka, Guangzhou, Ho Chi Minh City, Shanghai, Bangkok, Rangoon, and Hai Phong) Vulnerability of Asian coastal cities
Climate Change Literacy We have a responsibility to our children and grandchildren and people around the world. We MUST reduce our impact. 39
In Europe - Record setting August 2003 (more than 35,000 deaths) will be every second summer – by mid-century *A hot day is defined as a day with a maximum temperature above 30C • Actions: • Better design our structures and cities • more green space-shade-use of passive cooling • Heat alerts and responses – medical advice • Cleaner air 37 68 8 22 Projected More frequent hot days – virtually certain Warm spells – very likely Observed Canadian Centre for Climate Modelling and Analysis Centre canadien de la modélisation et de l’analyse climatique
No Breathing RoomNational Illness Costs of Air Pollution Canadian Medical Association (CMA) August 2008 1. In 2008, 21,000 Canadians will die from the effects of air pollution. 2. By 2031, almost 90,000 people will have died from the acute effects of air pollution. The number of deaths due to long-term exposure to air pollution will be 710,000. … 10. 11. In 2008, economic costs of air pollution will top $8 billion. By 2031, these costs will have accumulated to over $250 billion. The processes that result in air pollution are much the same as those that produce greenhouse gases. And more hot days will result in more smog days – for the same emissions
Projections - intense rainfall events, heat waves and smog episodes are likely to become more frequent. • Heat-related mortality could more than double in southern and central Ontario by the 2050s, while air pollution mortality could increase about 15 to 25% during the same interval. • The health of Ontario residents has been at risk … extreme weather, heat waves, smog episodes and ecological changes that support the spread of vector-borne diseases. • Walkerton, Ontario From Impacts to Adaptation: Canada in a Changing Climate 2007
$500M for the August 19, 2005 wind, rain event 43
Historical occurrences of urban flooding 1980, 1996, 2002, 2004 1 in 100 year event in 2002
Severe StormLoss of Service Sept. 29, 2005 93,000 Nov. 6, 2005 120,000 Nov. 16, 2005 50,000 Feb. 4, 2006 100,000 July 17, 2006 170,000 Aug. 2, 2006 150,000 Sept. 24+27, 2006 93,000 Wind Damage to Infrastructure More heavy precipitation events – very likely The Insurance Research Lab for Better Homes
Increased risk of drought Is Likely Boreal forest under stress Climate moves north faster than the trees Natural ecosystems depend on temperature and Precipitation. 550 ppm – mid-late this century Today
Warmer temperatures 184 175 183.5 X X 177 174 X 75.5 183 X X 173 176 74.5 X 182.5 Lake Superior 172 175 73.5 X X Lake Erie 174 72.5 Lakes Michigan-Huron Lake Ontario 1 metre drop in lake level possible Great Lakes Water Levels Current & Projected Ranges Warmer lakes and changing climate resulting in more invasive species in lakes and ecosystems How will this change our access to water, sewage disposal, shipping and recreation? X Average, 1918-1998 X Projected for 2XCO2, assuming no change in natural variability (CCC GCMII from Morstch & Quinn, 1996)
Climate Change is a Global Issue: Coastal vulnerabilities in light of global change • Sea level rise • Increasing settlement in coastal zones Time series of global mean sea level, as a deviation from 1980-99 mean.
Increasing urban settlement in low-lying coastal areas • IPCC has identified Asian mega deltas as “hot spots of vulnerability” • By 2070, nine of the top 10 cities in terms of population exposure will be found in Asia (Kolkata, Mumbai, Dhaka, Guangzhou, Ho Chi Minh City, Shanghai, Bangkok, Rangoon, and Hai Phong) Vulnerability of Asian coastal cities
Climate Change Literacy We have a responsibility to our children and grandchildren and people around the world. We MUST reduce our impact. 50