Skewness
Skewness. 9/27/2012. Readings. Chapter 2 Measuring and Describing Variables (Pollock) (pp.37-44) Chapter 6. Foundations of Statistical Inference (128-133) (Pollock) Chapter 3 Transforming Variables (Pollock Workbook) . Homework. Homework Due: Chapter 2 Pollock Workbook (10/2)

Skewness
E N D
Presentation Transcript
Skewness 9/27/2012
Readings • Chapter 2 Measuring and Describing Variables (Pollock) (pp.37-44) • Chapter 6. Foundations of Statistical Inference (128-133) (Pollock) • Chapter 3 Transforming Variables (Pollock Workbook)
Homework • Homework Due: Chapter 2 Pollock Workbook (10/2) • Question 1: A, B, C, D, E • Question 2: B, D, E (this requires a printout) • Question 3: A, B, D • Question 5: A, B, C, D • Question 7: A, B, C, D • Question 8: A, B, C
Office Hours For the Week • When • Friday and Monday 11-1 • Tuesday 8-12 • And appointment • Santa wears blublockers
Course Learning Objectives • Students will learn the research methods commonly used in behavioral sciences and will be able to interpret and explain empirical data. • Students will achieve competency in conducting statistical data analysis using the SPSS software program.
Camel Humps Dromedary (one hump) Bactrian (bi-modal)
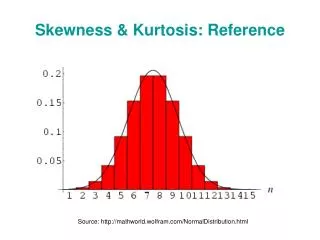
The Normal/Bell Shaped curve • Symmetrical around the mean • It has 1 hump, it is located in the middle, so the mean, median, and mode are all the same!
Why we use the normal curve • To determine skewness • The Normal Distribution curve is the basis for hypothesis/significance testing
What is skewness? • an asymmetrical distribution. • Skewnessis also a measure of symmetry, • Most often, the median is used as a measure of central tendency when data sets are skewed.
The Mean or the Median? • In a normal distribution, the mean is the preferred measure • In a skewed distribution, you go with the median
Testing for Skewness In the Descriptives Command In the Frequencies Command Click Here
Deviate from the norm? • Divide the skewness value • By the std. error of skewness
A distribution is said to be skewed if the magnitude of (Skewness value/ St. Error of Skew) is greater than 2 (in absolute value)
If the Value is Two or More Median
Baseball Salaries again • Divide the Skewness by its standard error • .800/.427 = 1.87 • This value is less than 2 so we use the mean (92 million) • What does the positive skew value mean???
Lets Try another One (Per Capita income in the states) • Divide the Skewness by its standard error • .817/.337 = 2.42 • The value is greater than two, and the skewness value is positive • What is the better measure and what might cause this distribution shape?
Simple Bar Charts • In SPSS • OPEN GSS 2008 • Analyze • Descriptive Statistics • Frequencies
Statistical Significance • A result is called statistically significant if it is unlikely to have occurred by chance • You use these to establish parameters, so that you can state probability that a parameter falls within a specified range called the confidence interval (chance or not). • Practical significance says if a variable is important or useful for real-world. Practical significance is putting statistics into words that people can use and understand.
What this Tells us • Roughly 68% of the scores in a sample fall within one standard deviation of the mean • Roughly 95% of the scores fall 2 standard deviations from the mean (the exact # is 1.96 s.d) • Roughly 99% of the scores in the sample fall within three standard deviations of the mean
A Practice Example • Assuming a normal curve compute the age (value) • For someone who is +1 s.d, from the mean • what number is -1 s.d. from the mean • With this is assumption of normality, what % of cases should roughly fall within this range (+/-1 S.D.) • What about 2 Standard Deviations, what percent should fall in this range?